
In the world of sports betting, information is not just power - it is currency. The era of betting based on "gut feeling" or because a team "looks due" is rapidly fading, replaced by a landscape dominated by algorithms, predictive modeling, and granular statistical analysis. For the intermediate bettor looking to transition from a casual hobbyist to a profitable sharp, the biggest hurdle is often not understanding the sport, but understanding the data that describes it.
However, we live in an age of information overload. A quick Google search for "betting stats" yields millions of results, ranging from free ad-supported database sites to premium services charging hundreds of dollars a month. The challenge isn't finding data; it's distinguishing between signal and noise.
This guide explores the data ecosystem available to modern bettors. We will break down the hierarchy of sports analytics, compare free resources against paid subscriptions, and help you construct a "tech stack" that aligns with your betting strategy and bankroll. whether you are wagering with Bitcoin on a high-limit crypto sportsbook or grinding out value on traditional apps, the data you use will ultimately dictate your long-term edge.
The Hierarchy of Betting Data
Before diving into where to find data, it is crucial to understand the different types of data available. Not all statistics hold the same weight in predictive modeling.
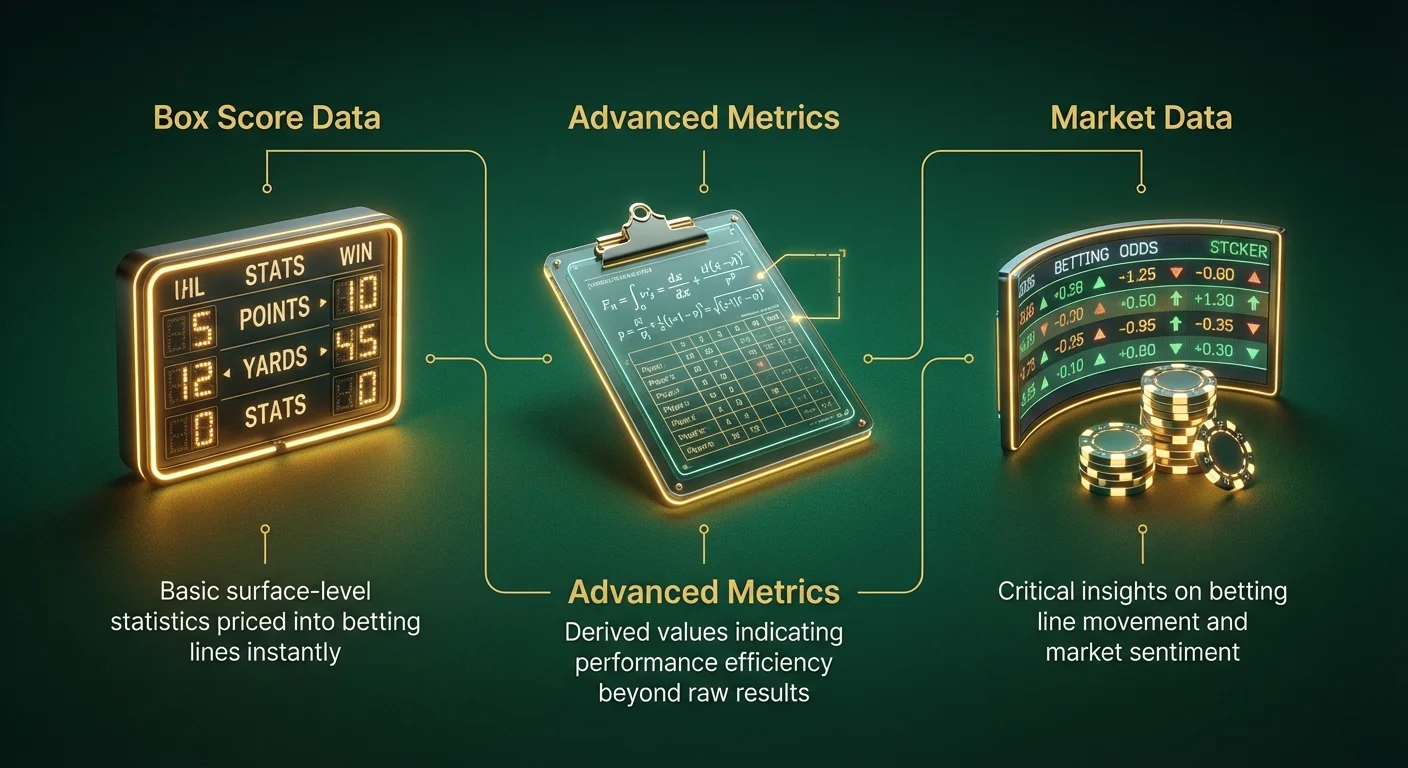
1. Box Score Data (Surface Level)
This is the most basic form of data: points per game, rushing yards, rebounds, win/loss records.
- Utility: Low. The market has already priced this information into the line instantly. If a team averages 110 points per game, the bookmakers know this. Betting strictly on box score data is rarely profitable long-term.
2. Derived and Advanced Metrics
This involves taking raw data and adjusting it for pace, opponent strength, or efficiency.
- Examples: Expected Goals (xG) in soccer, PER (Player Efficiency Rating) in basketball, DVOA (Defense-adjusted Value Over Average) in football.
- Utility: High. These metrics tell you how a team performed, not just what the result was. They are excellent for identifying regression - teams that are winning simply due to luck rather than skill.
3. Market Data
This is data about the betting lines themselves, not the sport.
- Metrics: Opening lines, closing lines, public betting percentage (ticket count), money percentage (handle), and line movement history.
- Utility: Critical. This helps you understand "market sentiment." It allows you to identify where the "sharp" money (professional bettors) is going versus the "square" money (casual public).
The Best Things in Life Are Free: Zero-Cost Resources
You do not need to spend a fortune to access high-quality data. In fact, some of the most robust databases are entirely free, provided you know how to query them.
Official League Repositories
Surprisingly, major sports leagues have begun releasing advanced tracking data to the public to drive engagement.
- NBA.com/Stats: This is arguably the most comprehensive free tool in sports. You can filter shooting percentages by zone, defensive matchups, and "hustle stats" (screen assists, deflections).
- NFL Next Gen Stats: utilizes RFID chips in player pads to track speed, separation, and route running. This is vital for player prop betting.
- MLB Statcast: Baseball is the grandfather of analytics. Statcast provides exit velocity, launch angle, and catch probability.
The "Reference" Family
For historical data, the Sports Reference network (Basketball Reference, Pro Football Reference, FBref, etc.) is the gold standard.
- Why use it: They allow you to export tables to Excel or CSV. This is essential for bettors building their own models.
- Key Feature: The "Play Index" (some features are now paid, but basic queries remain free) allows you to search for specific situational trends, such as "How do road underdogs perform in December in the NFL?"
Social Media and Beat Writers
In the age of instant information, Twitter (X) is faster than any news ticker.
- Strategy: Create a dedicated "list" for the sport you bet on. Follow the specific beat writers for every team.
- The Edge: You are looking for injury news, practice participation, or lineup changes before the sportsbooks adjust the odds. If a star player is ruled out, and you bet the Under or the opponent 30 seconds before the line moves, you have captured massive "Closing Line Value" (CLV).
When to Open the Wallet: Paid Data Services
At a certain point in your betting journey, free data may become too cumbersome to aggregate, or you may require real-time speed that free sites cannot provide. Here is a breakdown of when and why to upgrade.
1. Real-Time Odds Screens
Examples: Don Best, SpankOdds.
Cost: $100 - $300+ per month.
An odds screen shows the lines from dozens of sportsbooks simultaneously on a single grid.
- Why pay? Speed. Free odds comparison sites usually have a delay of 30 seconds to 5 minutes. Paid screens update in milliseconds.
- Who needs this? Bettors engaging in arbitrage or those trying to catch "steam moves" (when a syndicate hammers a line and all books move in unison).
2. Specialized Modeling Tools
Examples: KenPom (College Basketball), Warren Sharp (NFL), PFF (Pro Football Focus).
Cost: $20 - $100 per month.
These sites do the math for you. Instead of raw data, they provide efficiency ratings and projected scores.
- Why pay? Proprietary algorithms. Ken Pomeroy's college basketball ratings are so respected that Las Vegas bookmakers use them to set the opening lines.
- Who needs this? Bettors who don't have the time or coding skills to build their own Python/Excel models but want algorithmic support.
3. Positive EV and Arbitrage Finders
Examples: OddsJam, Unabated.
Cost: High ($100 - $1000/month).
These tools scrape odds from hundreds of books and mathematically identify instances where a sportsbook is offering odds that are "wrong" compared to the sharpest books in the world (like Pinnacle or betting exchanges).
- Why pay? It automates the process of finding profit.
- Who needs this? Volume bettors. You need a large bankroll to justify the subscription cost.
Comparison: Free vs. Paid
| Feature | Free Resources | Paid Services |
|---|---|---|
| Speed | Delayed (minutes to hours) | Real-time / Milliseconds |
| Depth | Surface & some advanced stats | Granular, proprietary metrics |
| Format | Web view, manual export | API access, CSV downloads, customizable dashboards |
| Analysis | Generic commentary | Expert analysis & predictive models |
| Best For | Learning, casual betting, props | Line shopping, arbitrage, high-volume betting |
Data That Actually "Moves the Needle"
Intermediate bettors often fall into the trap of analysis paralysis - consuming so much data that they cannot make a decision. To improve your game, focus on the variables that actually impact the probability of the outcome.
1. Injury Reports and Lineups
This is the single biggest factor in line movement.
- The Nuance: It's not just about who is out, but who replaces them. In the NBA, if a star is out, the betting public usually blindly bets against that team. However, if the replacement player is an efficient scorer and the usage rate is distributed well, the "Under" or the team spread might offer value due to market overreaction.
2. Weather Conditions
For outdoor sports (NFL, MLB, Soccer), weather is a primary variable.
- Wind: In the NFL, wind speed over 15 mph significantly impacts passing efficiency and kicking accuracy, favoring the "Under."
- Air Density: In MLB, warmer air is less dense, allowing the ball to travel further (Home Run friendly).
- Resources: specialized sites like "Kevin Roth Weather" provide betting-specific forecasts.
3. Market Percentage Splits (The "Fade the Public" Myth)
Many sites show "80% of bets are on Team A."
- The Trap: Following or fading the public blindly is a losing strategy.
- The Real Data: Look for the discrepancy between % of Bets (Tickets) and % of Money (Handle).
- Example: If 75% of tickets are on the Chiefs, but only 40% of the money is on them, that means the larger, sharper wagers are on the opponent. This is a "Reverse Line Movement" signal.
The Crypto Connection: Data in the Blockchain Era
For bettors using crypto sportsbooks, data analysis takes on a new dimension. Crypto betting platforms (like Stake, Cloudbet, or decentralized exchanges) often operate differently than traditional fiat books.
1. High Limits and Winning Players
If your data analysis makes you profitable, traditional fiat sportsbooks will often limit your account (e.g., maximum bet $5.00). Crypto sportsbooks generally operate on a "high volume" model and are more tolerant of winning players. If you are investing in paid data to become a sharp, you need a sportsbook that will actually take your action.
2. API Access
Many modern crypto casinos and sportsbooks offer open API access.
- For the Tech-Savvy: If you know Python or JavaScript, you can write scripts to pull odds directly from these books and feed them into your own models automatically. This allows for automated betting (botting) which is often prohibited on traditional sites but welcomed on some crypto exchanges.
3. Betting Exchanges
Platforms utilizing blockchain often host betting exchanges rather than traditional sportsbook models.
- The Data Advantage: Exchanges allow you to see the "order book" (how much liquidity is available at each price). This is the purest form of market data, showing exactly where the money is stacking up without the "vig" (juice) clouding the picture.
Building Your Analytics Tech Stack
You don't need to buy everything at once. Scale your tools with your bankroll.
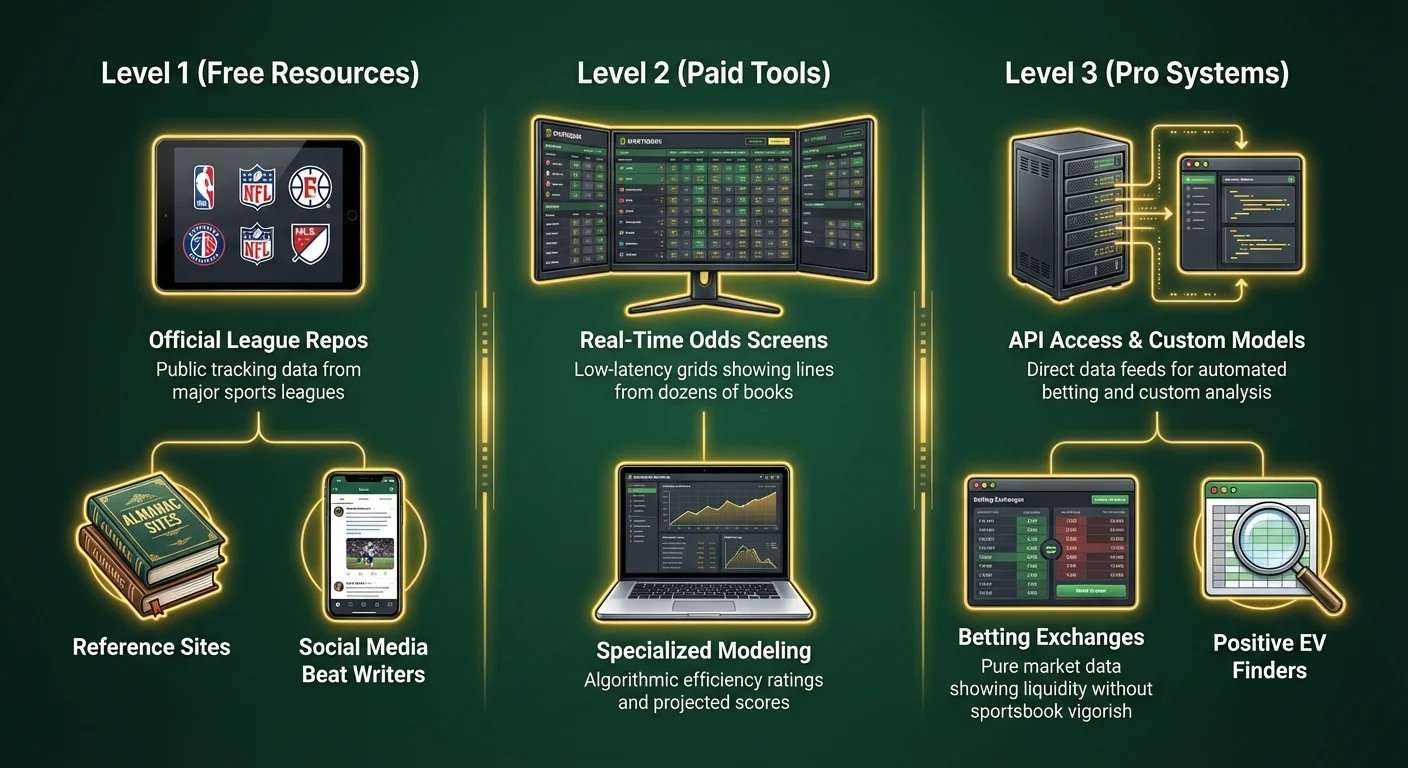
Level 1: The Weekend Warrior (Bankroll < $1,000)
- Stats: Official League Sites (NBA.com, NFL.com), Basketball/Pro-Football Reference.
- Odds: Free odds comparison apps (Action Network free version).
- News: Twitter lists of beat writers.
- Strategy: Focus on mastering one sport and learning to spot value using free stats.
Level 2: The Aspiring Sharp (Bankroll $1,000 - $10,000)
- Stats: Low-tier subscription (e.g., KenPom for CBB, FantasyLabs for player props).
- Odds: A single screen setup to compare lines across 5-10 books.
- Tools: Excel or Google Sheets. Start tracking your own bets and CLV.
- Strategy: You are now line shopping aggressively. You might use a crypto book for better odds and a fiat book for bonuses.
Level 3: The Semi-Pro (Bankroll $10,000+)
- Stats: Custom models, API feeds.
- Odds: Real-time paid odds screen (Don Best/SpankOdds).
- Tools: Automated alert systems for line movement.
- Strategy: You are betting on market inefficiencies. You likely pay for data that helps you identify arbitrage or +EV (Expected Value) situations instantly.
Practical Tips for Data Analysis
To wrap up, here are actionable strategies for integrating data into your workflow without getting overwhelmed.
- Standardize Your Inputs: If you use Expected Goals (xG) for soccer analysis, stick to one data provider (e.g., FBref). Different sites calculate xG differently. Mixing them will corrupt your model.
- Don't Pay for Picks: There is a difference between paying for data (information) and paying for picks (opinions). Data helps you build a process; picks just drain your bankroll.
- Calculate the ROI of the Subscription: If a data service costs $100/month, and your average bet size is $20, you need to win 5+ extra units just to break even on the tool. Ensure your volume justifies the expense.
- Watch for "Lagging" Indicators: Trends like "Team X is 8-2 ATS in their last 10 games" are lagging indicators. They tell you what happened, but not why. Look for "leading" indicators like yards per play or efficient shooting percentage, which predict future performance better than past wins.
- Verify the Source: In the crypto betting world, scams exist. Be wary of "insider data" sold on Telegram or Discord channels. Stick to reputable data providers with a track record.
Summary
Data is the bridge between gambling and investing. By moving away from emotional decision-making and utilizing the wealth of free and paid resources available, you significantly increase your chances of long-term profitability.
Start by exhausting the incredible free resources provided by leagues and database sites. Master the art of using Excel to find trends. Once your bankroll grows and your strategy matures, consider investing in real-time market data or advanced modeling tools. Remember, the goal is not to have the most data, but to have the most relevant data - and to act on it faster than the market can adjust.