
Understanding the price movements of volatile assets like Bitcoin requires more than just looking at candlestick charts. While traditional finance relies heavily on macroeconomic reports and fundamental company data, the crypto market offers a unique advantage: transparency. Because every transaction is recorded on a public ledger, sophisticated investors can analyze the quantifiable actions of the market’s most influential participants—the supply creators, the large holders, and the exchanges where trading occurs.
This analytical approach shifts the focus from passively observing price to actively understanding the supply and demand mechanics driven by specific actors. We move beyond simple valuation models to analyze short-term pressure, accumulation patterns, and underlying network stability.
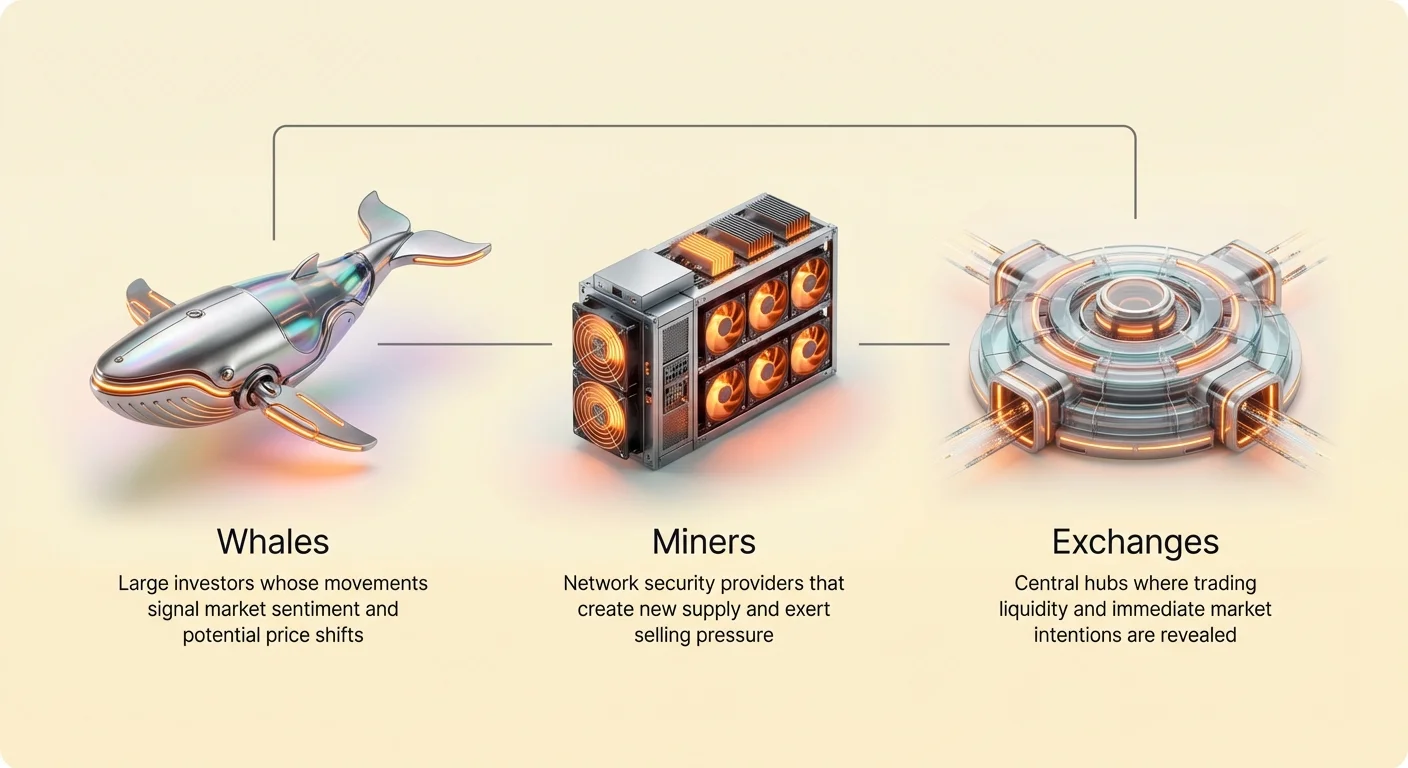
This guide adopts the perspective of a crypto investment analyst, detailing how to track and interpret the behaviors of "whales" (large investors), "miners" (the backbone of the network), and "exchange flows" (the immediate pulse of market intent) to build a robust investment thesis.
The Influence of Bitcoin Whales: Tracking Deep-Pocketed Holders
In any financial market, large-scale investors—often called "whales" due to their market-moving size—hold disproportionate power. In Bitcoin, tracking these entities is possible because blockchain analysis allows us to monitor wallets holding significant amounts of BTC. Whale movements often signal underlying confidence or pending distribution events.
Defining "Whale" Status: Wallet Cohorts and Supply Segmentation
A Bitcoin "whale" is generally defined as an entity controlling a large number of coins (often 1,000 BTC or more) across one or several related addresses. However, modern on-chain analysis segregates all holders into categorized cohorts to better segment their influence:
- Shrimps (Under 1 BTC): Represent the vast majority of individual retail investors. Their cumulative holdings are significant, but their individual trades have minimal impact.
- Crabs/Octopuses (10–100 BTC): Small-to-medium investors, often the first to buy in dips or sell during rallies.
- Sharks/Dolphins (100–1,000 BTC): High-net-worth individuals or smaller institutions. Their accumulation signals serious intent.
- Whales (1,000–5,000 BTC) and Humpbacks (5,000+ BTC): These are the institutions, funds, and earliest adopters whose activity can dramatically swing market sentiment and liquidity, particularly during periods of low volume.
By tracking the collective accumulation or distribution activity of these specific cohorts, analysts can gauge conviction levels. If Humpbacks are heavily accumulating while Shrimps are selling, it suggests smart money is positioning itself for a long-term move.
Whale Behavior Analysis: Accumulation vs. Distribution
The primary metric derived from whale tracking is the net position change over time.
Accumulation: When large wallets pull BTC off exchanges and hold it in private, non-custodial addresses (cold storage), they are effectively removing sellable supply from the market. This signals confidence and a commitment to HODLing (holding for the long term). Sustained accumulation by large holders typically precedes major uptrends, as the available supply shrinks.
Distribution: When whales move large quantities of BTC onto centralized exchanges, it usually means they are preparing to sell. This inflow adds immediate short-term selling pressure. Large, sudden spikes in whale deposits are often correlated with local price tops, as these large holders take profits into rallies.
Practical Metric: Stablecoin Flows and Market Entry
While tracking BTC flows is essential, watching stablecoin activity provides critical forward guidance regarding potential demand. Stablecoins (like USDT and USDC) act as the primary on-ramp and off-ramp liquidity within the crypto ecosystem.
When whales move massive amounts of stablecoins onto centralized exchanges, they are signaling imminent buying power. They are positioning fiat-equivalent cash to quickly acquire BTC or other assets. Conversely, when large stablecoin reserves are withdrawn from exchanges, it might suggest profit-taking is complete, and the funds are moving into private treasuries or being settled outside the crypto ecosystem.
Analyzing large, coordinated stablecoin inflows often acts as a precursor to significant rallies, providing a strong signal of deep-pocketed demand returning to the market.
The Critical Role of Bitcoin Miners in Supply and Security
Bitcoin miners are the production engine of the network. They secure the blockchain by validating transactions and, in exchange, receive newly minted BTC (the block reward) plus transaction fees. Their operations create the essential supply-side pressure in the market.
Understanding Miner Economics: Costs, Revenue, and Profitability
Miners are industrial businesses that operate on tight margins. Their revenue is generated entirely by the block reward (currently 6.25 BTC, plus fees), while their major costs are electricity, cooling, and capital expenditure (hardware).
This creates a constant miner selling pressure. Miners must frequently sell a portion of their earned BTC to cover their operational costs (known as the "energy ceiling"). When the price of BTC is high, they can cover costs by selling a smaller fraction of their reward, allowing them to accumulate the rest. When the price drops or the network difficulty increases, their profit margins shrink, forcing them to sell a larger percentage, or even their accumulated reserves, just to stay solvent.
Miner Selling Pressure (The "Capitulation" Event)
The most stressful period for miners—and a key analytical signal for investors—is miner capitulation. Capitulation occurs when the cost of mining exceeds the revenue generated, forcing less efficient or over-leveraged miners to shut down their machines and dump their remaining BTC reserves to pay off debts.
This is measured by metrics like the Hash Ribbon indicator, which tracks the 30-day and 60-day moving averages of the hash rate.
- Capitulation Phase (Bearish/Bottom Signal): When the hash rate drops significantly (the 30-day MA crosses below the 60-day MA), it signals that a large number of miners have gone offline. The market experiences forced selling pressure as these miners liquidate reserves. Historically, the capitulation period marks the final, painful wave of selling and often coincides with the absolute bottom of a bear market cycle.
- Recovery Phase (Bullish Signal): Once the weaker miners are flushed out, the hash rate stabilizes and begins to rise again. The remaining, more resilient miners command a larger share of the rewards, leading to a "miner recovery" phase. This period usually confirms that the worst selling is over and sets the stage for a new bull run.
Hash Rate and Network Security as a Market Signal
The hash rate—the total computational power dedicated to the Bitcoin network—is not just an indicator of miner profitability; it is the ultimate measure of the network's security and health.
A high and rising hash rate confirms the network is robust, decentralized, and difficult to attack. For investors, a stable or increasing hash rate is a crucial fundamental factor supporting Bitcoin’s long-term proposition as a reliable "store of value" and secure settlement layer. If the hash rate were to consistently decline without price compensation, it would suggest fundamental instability. Conversely, new all-time highs in hash rate are highly bullish, indicating increasing institutional and industrial commitment to the network, regardless of short-term price volatility.
Exchange Flow Dynamics: The Window into Short-Term Intent
While whale activity provides insight into deep-pocketed sentiment, tracking exchange flow dynamics provides the clearest, most immediate view of short-term investor intentions and market liquidity. Centralized exchanges (CEXs) are the choke points where the majority of buying, selling, and leveraged trading takes place.
Net Position Change: Inflows vs. Outflows
The exchange net position change is arguably the most vital metric for short-term analysis. It measures the difference between the total BTC flowing onto exchanges (inflows) and the total BTC flowing off exchanges (outflows) over a set period.
- Net Inflow (Bearish Pressure): When BTC deposits significantly exceed withdrawals, it means people are moving coins from cold storage or personal wallets onto the exchange trading books. This action is usually taken in preparation to sell or trade, leading to an increase in available supply and, consequently, short-term selling pressure.
- Net Outflow (Bullish Signal): When withdrawals significantly exceed deposits, it signals that investors are pulling their BTC off exchanges and moving them into secure, private cold storage. This is a strong HODL signal, indicating that investors are unwilling to sell at current prices and are removing supply from the immediate market. Sustained net outflows are a prerequisite for major supply shocks and subsequent price rallies.
Exchange Balance Decline (The HODLing Signal)
The Total Exchange Balance is the cumulative amount of BTC held across all tracked centralized exchange wallets. This metric is a powerful proxy for aggregate market risk.
A continually declining exchange balance means that the total available supply of BTC that could be sold at any moment is shrinking. This signifies collective conviction and self-custody adoption. As the accessible liquid supply dwindles, the market becomes increasingly vulnerable to sharp upward moves when demand arrives—a fundamental supply shock dynamic.
Conversely, a rapidly rising total exchange balance suggests high uncertainty. Investors are parking large amounts of coins on exchanges, ready to sell immediately if sentiment turns negative, creating a latent overhang of selling pressure.
Analyzing Derivatives and Funding Rates
While spot market flows (actual BTC buying/selling) are the foundation, the derivatives market (futures and perpetual swaps) often dictates short-term volatility, especially through leverage.
Funding Rate: This is a small, periodic payment made between leveraged traders.
- Positive Funding Rate: Long traders (those betting on a price rise) are paying short traders. This means the market is overly bullish, aggressively leveraged long, and potentially overheated. High positive funding rates often precede a "long squeeze" or liquidation cascade.
- Negative Funding Rate: Short traders (those betting on a price drop) are paying long traders. This indicates the market is overly bearish. Extremely negative rates can signal a near-term bottom, as short sellers become susceptible to a swift "short squeeze."
Monitoring funding rates in conjunction with exchange flows allows analysts to gauge whether the selling pressure is spot-driven (actual liquidation) or derivative-driven (leveraged traders being wiped out).
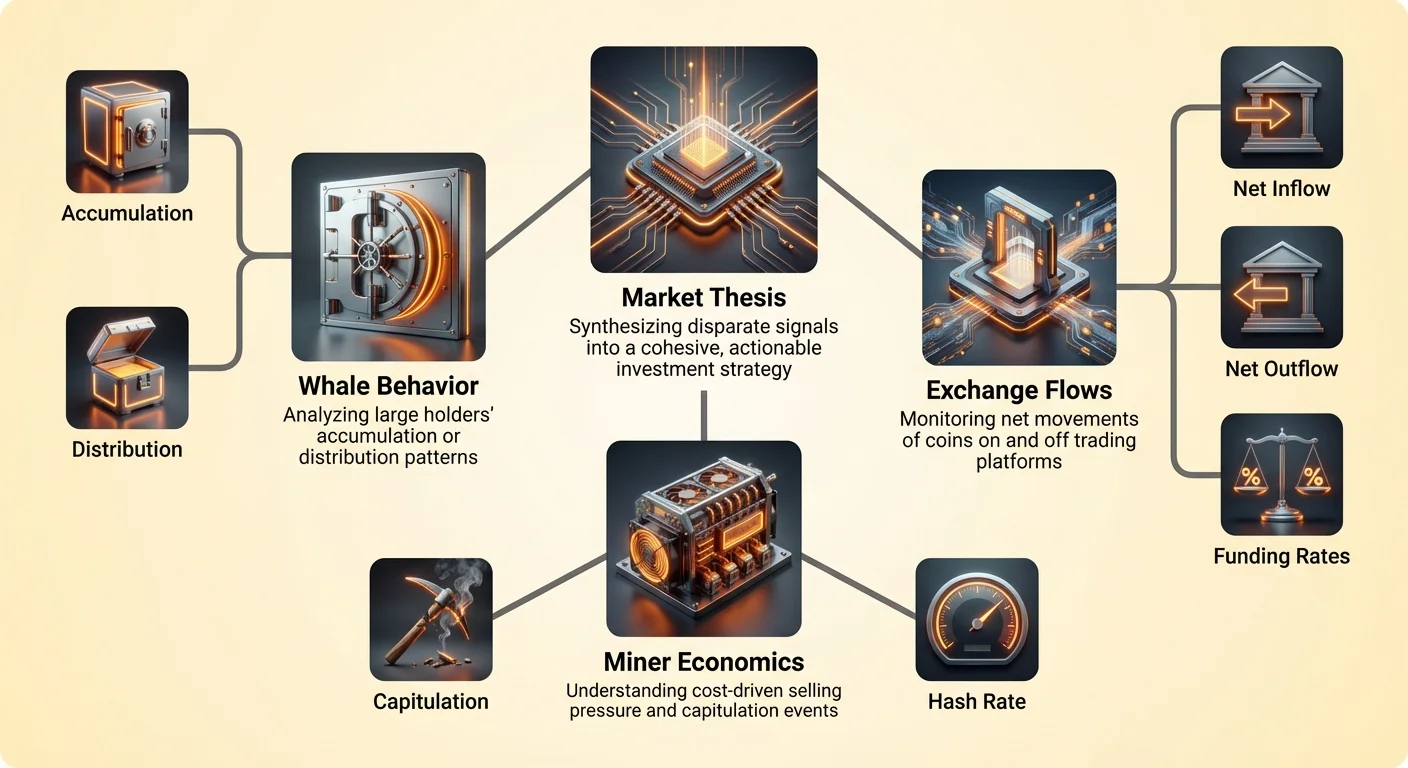
Sinteza podatkov: Gradnja tržne teze
Analiza kitov, rudarjev in pretokov na borzah v izolaciji zagotavlja delne vpoglede. Prava moč analize strukture trga izhaja iz sinteze teh razliènih signalov v koherentno, izvedljivo tezo.
Združevanje signalov kitov, rudarjev in borz
Medsebojni odnosi med temi tremi akterji pogosto pojasnjujejo hitre gibe cen, ki se na preprostih cenovnih grafikonih zdijo v nasprotju z intuicijo.
| Aktivnost kitov | Aktivnost rudarjev | Pretok na borzi | Tržna teza |
|---|---|---|---|
| Akumulacija (Drženje) | Kapitulacija (Agresivna prodaja) | Neto odtok (Odstranjevanje BTC) | MOÈEN SIGNAL DNA: Kitovi absorbirajo prisilno prodajo rudarjev in premikajo kovance v hladno shrambo. Ponudba se krèi, medtem ko vstopa denar z visoko preprièanostjo. |
| Distribucija (Vplaèilo za prodajo) | Dobièkovno (Nizka prodaja) | Neto priliv (Vplaèilo za prodajo) | Tveganje korekcije: Najveèji imetniki distribuirajo ponudbo na trg, kar nakazuje zaèasni vrh ali željo po realizaciji dobièkov. |
| Nevtralno/Lahka akumulacija | Dobièkovno (Prodaja standardne kolièine) | Vzpon celotnega stanja (Èakanje) | NEGOTOVOST: Trg èaka na katalizator. Likvidnost je visoka, kar pomeni, da lahko majhni dogodki sprožijo veliko nihanje. |
S križnim preverjanjem teh pozicij lahko vlagatelj ugotovi, ali kratkoroèni medvedji pritisk (kot prodaja rudarjev) absorbirajo visoko preprièani dolgoroèni imetniki (kitovi), ali pa se ta prodaja kopièi s širšo likvidacijo trga.
Kljuèna tveganja in omejitve analize na verigi
Kljub moèi analiza strukture trga prek podatkov na verigi ni nezmotljiva in jo je treba obravnavati z oprezom:
- Nejasnost lastništva denarnice: Vidimo, kaj denarnica poène, vendar ne vemo vedno, kdo jo nadzoruje (npr. Ali je to hedge sklad, posameznik ali korporativna blagajna, kot MicroStrategy?). To omejuje gotovost »namena«.
- Notranji prenosi: Veliki gibi kovancev z ene naslove na drugo morda niso prodaja, temveè le notranje preurejanje hladne shramb v borzi ali skrbnik, ki premika sredstva strank. Analitiki morajo uporabljati filtrirne heuristike, da loèijo pristne tržne gibe od notranjih operacij.
- Èrni labodi: Podatki na verigi predvsem sledenje organski ponudbi in povpraèevanju. Ne morejo napovedati nenadnih, nekvantificiranih zunanjih dogodkov, kot so regulativne represije, globalna makro nestabilnost ali neprièakovane tehnološke okvare, ki lahko preglasijo vse akumulirane tehniène signale.
Da bi omilili te omejitve, bi morala analiza strukture trga vedno združevati z makro okviri, obravnavanimi na straneh, kot je Na-verigi proti makro modelom vrednotenja, in kontekstualizirati z znanjem o glavnih dinamikah ponudbe, obravnavanih v Ekonomija šoka ponudbe: Analiza cikla halvinga Bitcoina.
Zaključek
Cena Bitcoina ni naključni sprehod; je opazljiv izid kvantificiranih akcij glavnih udeležencev trga. S študijem pretokov, ki jih poganjajo kitovi, fundamentalne ekonomike rudarjev in takojšnjih pritiskov, odraženih v stanjih izmenjav, vlagatelji presegajo špekulacije in pridobijo analitično prednost.
Sledenje akterjem strukture trga vlagateljem omogoča razumevanje kamor gre ponudba (hladno shranjevanje proti izmenjavam) in kdo ustvarja kratkoročno nihanje (vzdraženi trgovci proti prisilnim prodajalcem). Ta sofisticiran pristop tvori temelj proaktivne naložbene teze, ki omogoča strateške odločitve med vrhom evforije in maksimalno bolečino. Ta premik s pasivnega opazovanja na aktivno analizo je ključen korak na poti proti finančni samo-suverenosti v digitalni ekonomiji.