
In traditional finance, analysts spend significant time tracking which sectors money is moving into and out of. Are investors buying bonds or stocks? Are they favoring technology or consumer staples?
In the cryptocurrency ecosystem, this tracking is even more vital. Due to the high correlation among major assets, market movements are often less about specific project performance and more about wholesale capital rotation. Understanding where liquidity is flowing—whether new cash is entering the system, or existing cash is shifting between Bitcoin and altcoins—is the difference between successful positioning and being caught off-guard by a market swing.
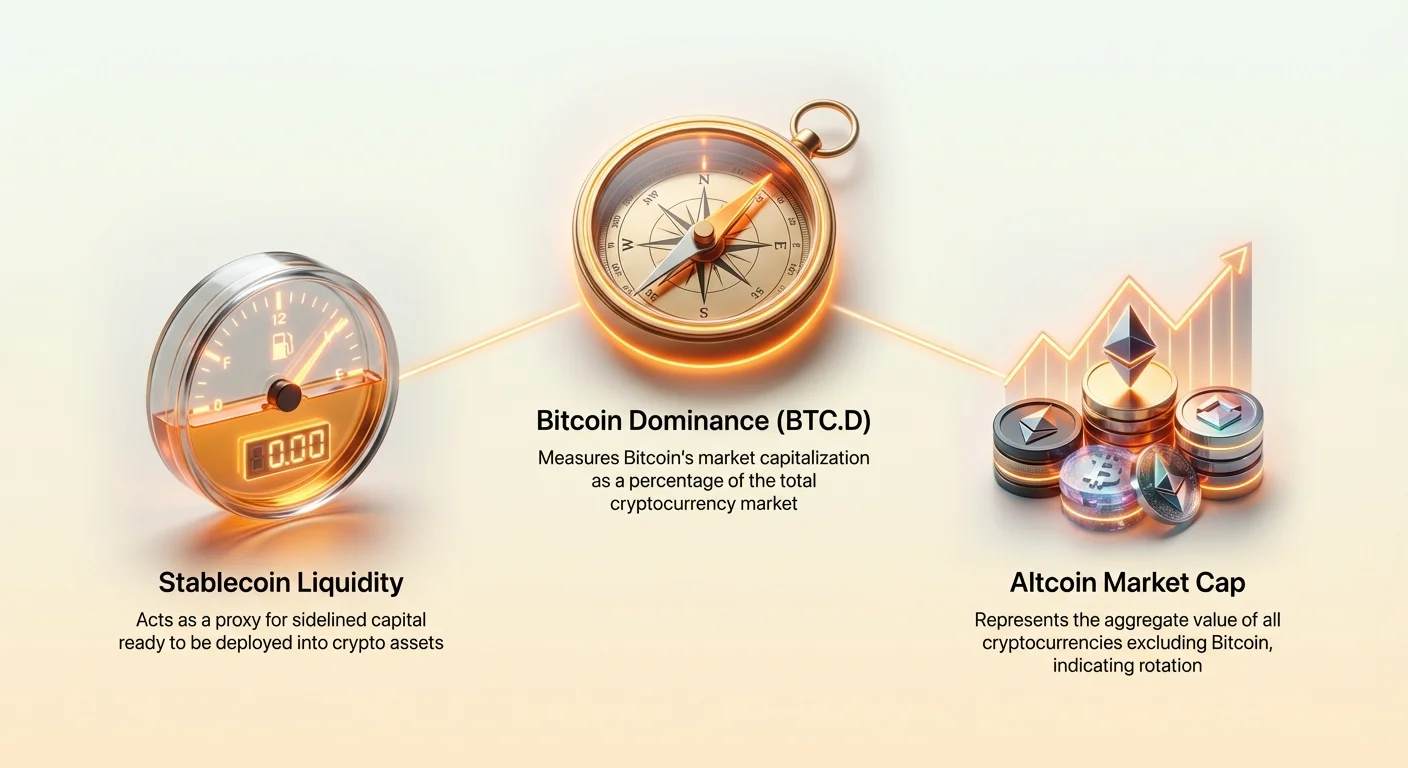
This guide provides the framework for conducting fundamental capital flow analysis. We will move beyond simple price charting to look at three interconnected metrics: Bitcoin Dominance, the overall supply of stablecoins, and the total market capitalization of the altcoin universe. By synthesizing these indicators, you can develop an informed "investment analyst" perspective on market dynamics and accurately time periods of high speculation versus periods of consolidation and safety.
The Foundation: Total Crypto Market Capitalization
Before we can analyze flows, we must understand the container the money sits in: the Total Crypto Market Capitalization.
The total market cap is simply the aggregate value of every cryptocurrency currently in circulation. It is calculated by taking the circulating supply of an asset and multiplying it by its current price, and then summing up these totals for every coin and token in existence.
The Total Market Cap is often viewed as the primary measure of the industry’s size and health. When this number increases, it signals that net capital is flowing into the crypto economy. When it decreases, it signals that net capital is flowing out of the system (typically being converted back into fiat currency or stablecoins).
However, looking only at the total size is insufficient. We need to dissect where that capital is allocated internally—and that starts with Bitcoin Dominance.
Understanding Bitcoin Dominance (BTC.D): The Benchmark
Bitcoin Dominance, often referred to as BTC.D, is perhaps the most critical metric for understanding market sentiment and anticipating capital rotation.
BTC.D measures Bitcoin’s market capitalization as a percentage of the total cryptocurrency market capitalization. It shows how much of the collective value of the entire digital asset space is concentrated in Bitcoin.
How Dominance is Calculated
The calculation is straightforward:
If the total market cap is $1 trillion and Bitcoin’s market cap is $500 billion, then BTC Dominance is 50%. This means that for every dollar invested in crypto, 50 cents are currently allocated to Bitcoin.
Dominance as a Risk Gauge and Sentiment Indicator
The movement of BTC Dominance provides deep insight into the collective risk appetite of the market. Since Bitcoin is the longest-standing, most decentralized, and most institutionally-accepted cryptocurrency, it is often treated as the "safest" store of value within the volatile crypto space.
- Rising Dominance (Risk-Off): When investors become fearful, uncertain, or when a major price collapse occurs, they often consolidate their assets into BTC. A rising BTC.D suggests that capital is being pulled out of smaller, riskier altcoins and parked back into the benchmark asset. This is often a sign of market deleveraging or the start of a bear cycle. Conversely, rising dominance can also occur during the very start of a bull market, as Bitcoin usually moves first, establishing the foundation before speculators branch out.
- Falling Dominance (Risk-On): A falling BTC.D indicates that investors are moving capital out of Bitcoin and into more volatile, high-growth potential altcoins. This signals high confidence, speculative fervor, and a "risk-on" environment. This movement is a necessary precursor for an Altcoin Season.
The Dominance Cycle: BTC First, Altcoins Later
Historical analysis reveals a typical cycle of capital rotation governed by BTC Dominance:
- Phase 1: Bitcoin Takes Center Stage (Dominance Rises): A fresh bull cycle usually begins with Bitcoin leading the charge. Large institutional capital, which prioritizes security and liquidity, enters BTC first. This drives Bitcoin’s price up significantly, causing BTC.D to rise (e.g., from 40% to 55%).
- Phase 2: Consolidation and Stabilization (Dominance Plateaus): After a rapid BTC climb, the price tends to consolidate horizontally. Investors who made large gains in BTC start looking for ways to multiply those gains.
- Phase 3: The Altcoin Rotation (Dominance Falls): The profits generated from Bitcoin are rotated into large-cap altcoins (like Ethereum), and then later into small-cap and highly speculative tokens. This widespread rotation drives the prices of altcoins up much faster than Bitcoin, causing the Bitcoin Dominance index to plummet, signaling "Altcoin Season."
- Phase 4: Market Crash (Dominance Rises Sharply): When the inevitable market correction or crash occurs, speculative altcoins are hit the hardest. Investors panic and rush to convert high-risk assets back into the lowest-risk digital asset (Bitcoin) or, more often, stablecoins. During the initial drop, BTC.D often spikes as altcoin values collapse faster than BTC’s value.
Liquidity Plumbing: The Role of Stablecoins (USDT/USDC)
While BTC Dominance tells us where the existing crypto money is located, it doesn't tell us if new money is entering the system. For that, we turn to stablecoins.
Stablecoins, such as Tether (USDT) and USD Coin (USDC), are crucial because they act as the primary on-ramps and off-ramps for fiat currency. They represent US dollars (or other fiat currencies) that have been digitized and injected into the crypto ecosystem.
Stablecoin Market Cap as a Liquidity Proxy
The total market capitalization of the major stablecoins serves as a robust proxy for the amount of sidelined capital—the dry powder—ready to be deployed.
When the aggregate stablecoin market cap rises, it means that new fiat currency is flowing into the ecosystem and is currently sitting in a digital dollar format, waiting for an investment opportunity. This increasing supply of stablecoins provides the essential fuel for future price rallies.
Conversely, if the stablecoin market cap is shrinking, it means capital is actively being withdrawn from the crypto ecosystem and redeemed back into traditional bank accounts.
The ‘Fuel Gauge’ Analogy: Interpretation of Supply Changes
Analysts use stablecoin supply changes in conjunction with price action to gauge market pressure:
| Stablecoin Market Cap Trend | BTC/Altcoin Price Trend | Interpretation | Market Signal |
|---|---|---|---|
| Rising | Falling or Flat | New capital is entering the system and accumulating "on the sidelines" (buying the dip). | Bullish Pressure Building |
| Rising | Rising | Fresh capital is flowing directly into crypto assets and driving prices higher. | Strong Bullish Momentum |
| Falling | Rising | The existing pool of stablecoins is being actively deployed, suggesting liquidity may soon be constrained. | Caution: Liquidity Squeeze |
| Falling | Falling | Investors are converting crypto back to stablecoins and then exiting the ecosystem (redeeming). | Strong Bearish Exit |
Actionable Insight: The most bullish long-term signal is usually a sustained period where the stablecoin market cap rises while asset prices remain flat or drop. This suggests sophisticated buyers are preparing massive reserves to deploy when they deem the conditions right.
Analyzing the Altcoin Season
The ultimate goal of capital flow analysis is to identify when the highly profitable Altcoin Season (or "Alt Season") is beginning. Alt Season is defined by a period where the vast majority of altcoins significantly outperform Bitcoin.
Defining Altcoin Season and Its Precursors
Altcoin Season requires two critical precursors:
- A Stable or Established Bitcoin Base: Altcoins rarely rally in isolation. A foundational base—where Bitcoin has already seen a significant run-up and has entered a period of consolidation—is necessary to breed the confidence required for riskier plays.
- High Liquidity Reserves: Without sufficient dry powder (stablecoins) or rotation of existing BTC profits, altcoins cannot sustain a large rally.
A common definition for the peak of Alt Season is when at least 75% of the top 50 altcoins (excluding stablecoins) have outperformed Bitcoin over the preceding 90 days.
The Tangle of Metrics: Dominance + Liquidity
True Altcoin Season is not simply indicated by a falling BTC.D. A falling BTC.D accompanied by an overall shrinking Total Market Cap usually means everything is falling, but altcoins are falling faster—this is a crash, not a rotation.
To confirm a true Alt Season rotation, the following relationship must hold true:
- BTC Dominance (BTC.D) is decreasing. (Capital is leaving Bitcoin.)
- Total Stablecoin Market Cap is stable or increasing. (Sufficient liquidity exists to support altcoin prices.)
- The Altcoin Market Cap is increasing. (The money leaving BTC is moving directly into altcoins.)
If BTC.D is decreasing, but the stablecoin supply is also decreasing sharply, the capital is likely exiting the entire system, signaling a sharp end to the current market cycle.
Total Market Cap Ex-BTC (TOTAL3)
For an even clearer view of pure altcoin performance, analysts often use specialized chart indicators that filter out the largest assets.
- TOTAL: Total Crypto Market Cap (includes everything).
- TOTAL2: Total Crypto Market Cap excluding Bitcoin. This gives a clearer view of the performance of the entire altcoin sector, including large caps like Ethereum.
- TOTAL3: Total Crypto Market Cap excluding Bitcoin and Ethereum. This metric is often the best gauge for small- and mid-cap altcoin performance.
When analyzing the potential for Alt Season, the most powerful signal is seeing a rising TOTAL2 or TOTAL3 chart alongside a falling BTC.D chart. This confirms that profits are actively rotating down the risk curve and creating significant momentum in the lower-cap assets.
Practical Capital Flow Scenarios
By combining Bitcoin Dominance, Stablecoin Supply, and the Total Altcoin Market Cap, we can diagnose the current state of the market and anticipate future rotations.
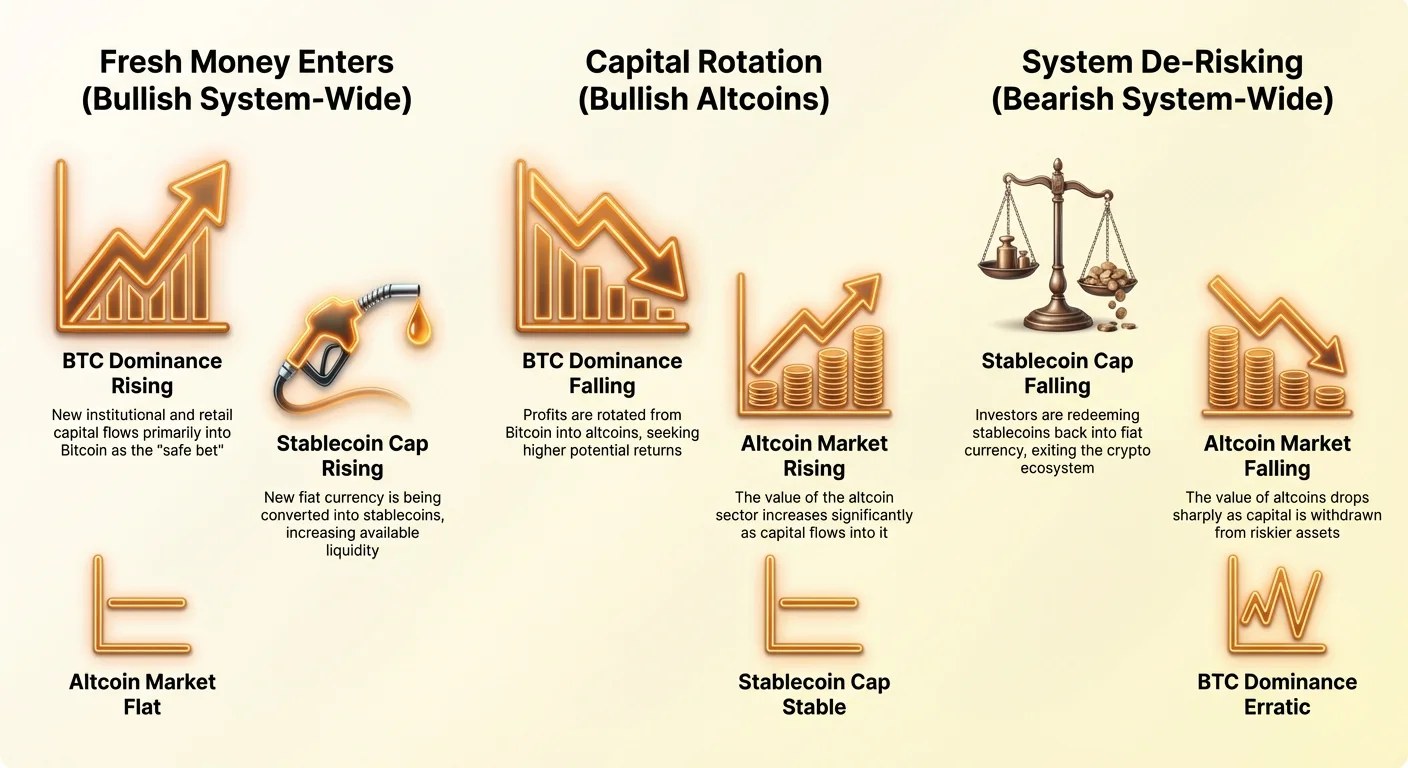
Scenario A: Fresh Money Enters (Bullish System-Wide)
The Dynamics: This scenario typically occurs after a prolonged bear market or correction, marking the start of a major uptrend. Institutional and new retail money flows into the system.
| Metric | Trend | Meaning |
|---|---|---|
| BTC Dominance | Rising | BTC is the primary destination for new money (the risk-off/safe bet). |
| Stablecoin Cap | Rising | Massive amounts of new fiat are entering the system. |
| TOTAL2/TOTAL3 | Flat/Modestly Rising | Altcoins are trailing BTC, but liquidity is building. |
Investment Implication: This is the time to build a core position in Bitcoin. Liquidity is confirming the uptrend, but rotation into smaller, riskier assets has not yet begun. BTC offers the highest risk-adjusted reward during this phase.
Scenario B: Capital Rotation (Bullish Altcoins)
The Dynamics: This scenario occurs after Bitcoin has achieved a high price peak and is now consolidating. Profits are being taken from BTC and redistributed into altcoins seeking exponential growth. This is the heart of Alt Season.
| Metric | Trend | Meaning |
|---|---|---|
| BTC Dominance | Falling Sharply | Capital is actively moving out of the benchmark asset. |
| Stablecoin Cap | Stable/Modestly Rising | Liquidity is sufficient to fuel altcoin rallies; there is no systemic exit. |
| TOTAL2/TOTAL3 | Rising Sharply | Altcoins are outperforming BTC, confirming the rotation. |
Investment Implication: This is the most opportunistic phase for altcoin investors. The strategic move is to rotate high-performing BTC into strong narrative-driven altcoins that have not yet moved, positioning for maximum gains until BTC.D hits historically low levels (often sub-40%).
Scenario C: System De-Risking (Bearish System-Wide)
The Dynamics: This scenario is the final stage of a bull run or the onset of a bear market. Investors panic, exit altcoins, and convert their holdings back into stablecoins to preserve capital or prepare for a full exit.
| Metric | Trend | Meaning |
|---|---|---|
| BTC Dominance | Erratic, often spiking | Altcoins are collapsing much faster than BTC. |
| Stablecoin Cap | Falling Sharply | Investors are redeeming stablecoins back into fiat (exiting the system). |
| TOTAL2/TOTAL3 | Falling Sharply | The altcoin market is in deep correction. |
Investment Implication: This phase requires caution. The smart move is to significantly reduce exposure to volatile altcoins and, potentially, convert assets into stablecoins until the capital outflow stabilizes. Waiting for the stablecoin market cap to bottom out and begin rising again (Scenario A precursor) is often the safest entry signal.
Best Practices for Flow Analysis
Analyzing capital flows is a nuanced skill that requires discipline and a long-term view.
1. Focus on Trends, Not Daily Noise
Capital flow indicators are macro-metrics. A single day of high or low stablecoin minting or a 1% shift in BTC.D is noise. Focus on 7-day, 30-day, and quarterly trends. Are the flows sustained? A major shift in market dynamics usually takes several weeks to unfold.
2. Understand Correlation with Price
Always interpret capital flow metrics alongside the price action of the assets themselves. For instance, if Bitcoin’s price is soaring but BTC Dominance remains flat, it suggests that the Total Market Cap is growing in lockstep, likely meaning major altcoins like Ethereum are also performing strongly—a sign of early systemic health.
3. Consider Exchange Flow Context
While Stablecoin Market Cap shows overall system liquidity, the movement of stablecoins onto exchanges signals immediate buying intent. If the total stablecoin supply is high, but large quantities are being transferred from self-custody wallets onto major exchanges, it often precedes a large buy order, reinforcing the bullish signal derived from the supply metric. (This ties into the detailed flow analysis covered in the related page: Market Structure: Analyzing Whales, Miners, and Exchange Flow Dynamics).
4. Use Logarithmic Charts
When charting BTC Dominance over a long timeframe, utilize logarithmic scales. Dominance often moves within long-term bands (e.g., 35% to 70%). Log charts help identify crucial historical resistance and support zones for the index itself, which often serve as major pivot points for market rotation.
Zaključek
Analiza pretokov kapitala je umetnost branja kolektivnega uma trga. S sledenjem dominance Bitcoina merite apetit trga po tveganju. Z spremljanjem tržne kapitalizacije stabilcoinov merite potencialno gorivo za prihodnje rallye. In s sledenjem skupne tržne kapitalizacije brez BTC potrjujete dejansko rotacijo v sektor altcoinov.
Obvladovanje teh treh metrik vam omogoča, da presežete zgolj opazovanje cenovnih grafikonov in namesto tega zagotavlja strukturni okvir za razumevanje zakaj se cene gibljejo. Za vsakega ambicioznega investitorja v kripto je sposobnost napovedovanja rotacije kapitala – iz fiata v BTC, iz BTC v altcoine in nazadnje nazaj v stabilcoine – temeljno orodje za strateško pozicioniranje portfelja.