
Trgovina s kriptovalutami se močno zanaša na sposobnost hitrega in natančnega interpretiranja vizualnih podatkov. Grafikoni cen niso le črte in palice na zaslonu. Predstavljajo kolektivno psihologijo milijonov udeležencev na trgu. Vsak premik navzgor predstavlja nakupni pritisk, vsak gib navzdol pa nakazuje prodajno namero. Med različnimi orodji, ki so na voljo trgovcem, svečni vzorci ostajajo ena najbolj priljubljenih metod za merjenje tržnega razpoloženja.
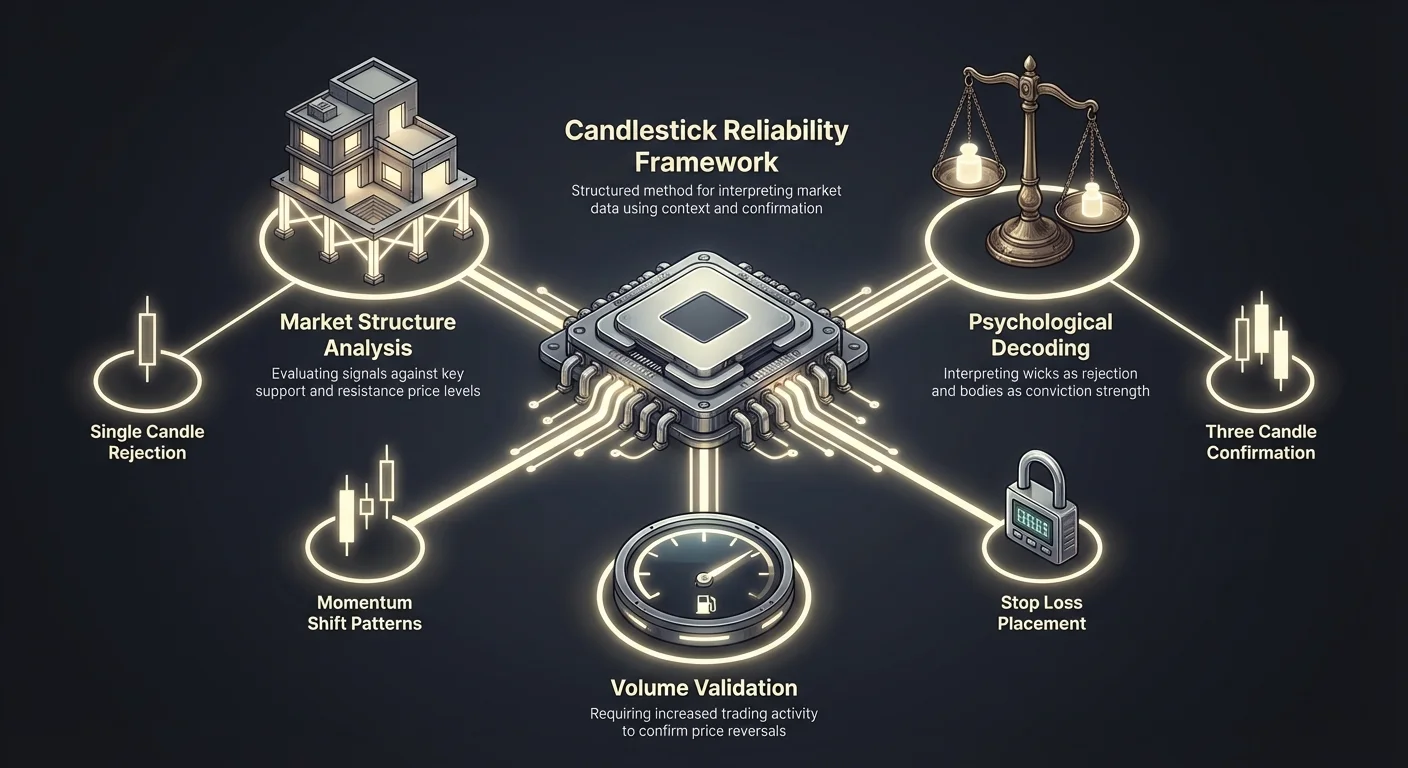
Vendar je vzorec v izolaciji pogosto brez pomena. Zelena sveča na stranskem trgu pomeni nekaj zelo drugačnega kot ista sveča po pomembnem padcu. Za učinkovito trgovanje je treba uporabiti okvir zanesljivosti, ki ocenjuje te vzorce na podlagi njihovega specifičnega konteksta trga. Ta pristop presega preprosto prepoznavanje vzorcev in vstopa v področje strateške analize. Z razumevanjem specifičnih meril, psiholoških temeljev in zahtev po potrditvi za ključne vzorce lahko trgovci bolje krmarijo po nestanovitni kripto krajini.
Osnove kontekstualne analize
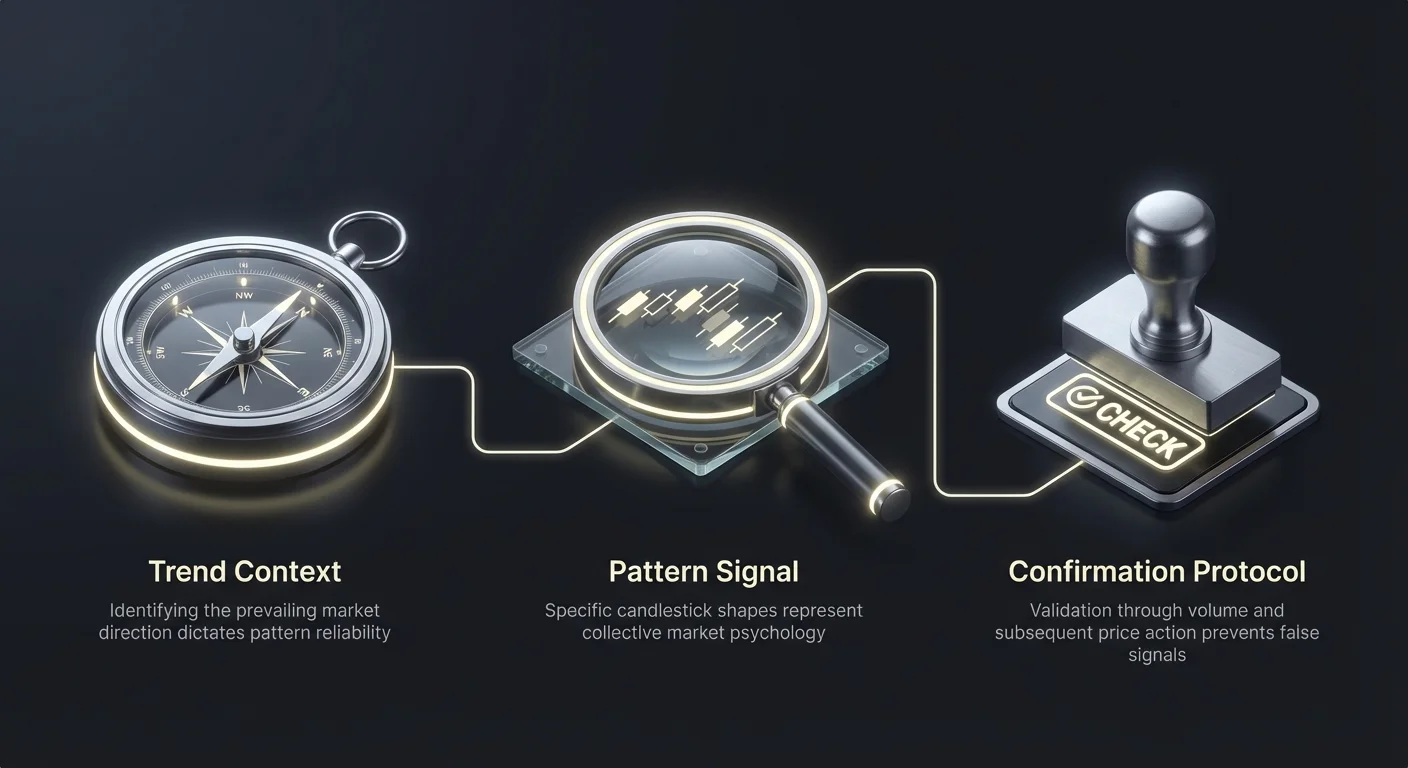
Uspešna tehnična analiza se začne z razumevanjem, da kontekst določa zanesljivost. Močan signal obrata je veljaven le, če obstaja uveljavljen trend za obrniti. Določanje prevladujoče smeri trga je prvi korak v okviru zanesljivosti. Brez jasnega naraščajočega ali padajočega trenda vzorci obratov pogosto generirajo lažne signale.
Ustanavljanje predpogojev
Glavno pravilo za vsak vzorec obrata je obstoj prejšnjega trenda. Bikovskega vzorca obrata, kot je kladivo ali jutranja zvezda, v bistvu signalizira, da padajoča pot doseže dno. Če se trg giblje stransko ali nihajoče v ozkem območju, pojav teh sveč pogosto pomeni le šum.
Trgovci morajo preveriti, ali je sredstvo prestalo obdobje vztrajne prodaje, preden iščejo bikovske znake. Nasprotno bikovski vzorci zahtevajo jasen naraščajoči trend. Streljajoča zvezda ali večerna zvezda v bistvu opozarja, da je strop blizu. Če cene niso naraščale, ni zagonu, ki bi ga lahko prodajalci ustavili. Močnejši in daljši kot je predhodni trend, pomembnejši je potencialni signal obrata.
Vloga podpore in odpora
Zanesljivost katerekoli svečne formacije se znatno poveča, ko se ujema s ključnimi tržnimi strukturami. Podporna območja so nivoji cen, kjer je zgodovinsko nakupni interes bil dovolj močan, da premaga prodajni pritisk. Oporna območja so nivoji, kjer je prodajni interes zgodovinsko ustavil rast cen.
Ko se bikovski vzorec oblikuje neposredno na glavni podporni črti, se signal okrepi. Nakazuje, da tehnično dno drži in da kupci stopajo noter natanko tam, kjer je pričakovano. Podobno bikovski vzorec na znanem nivoju odpora potrjuje, da je ponudba kovancev nad glavo še vedno prisotna. Ta konvergenca vzorca in lokacije je ključna sestavina ocenjevanja kakovosti nastavitve. Vzorec, ki lebdi sredi trgovalnega območja, ima veliko nižjo oceno zanesljivosti kot tisti, ki interagira z zgodovinskimi cenovnimi ovirami.
Single-Candle Rejection Signals
Single-candle patterns are the most basic building blocks of technical analysis. They offer immediate feedback on intraday battles between bulls and bears. While they are simple to spot, they require strict adherence to identification formulas to avoid confusion with standard market noise.
The Rising Hammer
The rising hammer is a quintessential bullish reversal signal. It tells a dramatic story of intraday recovery. The session begins with sellers driving the price down, continuing the prevailing downtrend. However, at some point during the period, buyers find value and aggressively step in. They absorb the selling pressure and push the price back up, closing near the opening level.
To grade a hammer as high-quality, specific criteria must be met. The lower shadow, or wick, must be at least two to three times the length of the body. This long wick visually represents the failed attempt by sellers to push the market lower. The real body should be small and situated at the top of the candle. While a green body is preferred because it shows bulls actually won the session, a red body is acceptable if the wick is sufficiently long. The upper shadow should be virtually nonexistent, indicating that once buyers took control, they held it until the close.
The Shooting Star
The shooting star acts as the bearish mirror to the hammer. It appears after an uptrend and warns that buyers are losing their grip on the market. The psychological narrative here involves a "bull trap." The session opens, and buyers immediately push prices to new highs, driven by momentum or FOMO (fear of missing out).
However, sellers utilize these higher prices to offload their holdings. This selling pressure overwhelms the buyers, driving the price back down to close near the open. The result is a candle with a small body at the bottom and a long upper wick. For a reliable signal, this upper wick must be at least two to three times the size of the body. The long wick serves as a monument to the failed rally. It shows that higher prices were rejected by the market. Just like the hammer, the color of the body is secondary to the structure, though a red body indicates a stronger bearish close.
Two-Candle Momentum Shifts
While single candles show rejection, two-candle patterns show a complete transfer of control. These patterns are often considered more reliable because they involve a confirmable shift in momentum over two distinct periods. The "Engulfing" family of patterns represents this decisive change in market leadership.
Bullish Engulfing Mechanics
The bullish engulfing pattern is a loud signal that buyers have overpowered sellers. It occurs after a downtrend and consists of two specific candles. The first is a red candle, consistent with the ongoing bearish trend. It reflects that sellers were still in control during that period.
The second candle changes the narrative entirely. It is a large green candle that opens lower than the previous close but rallies significantly. Crucially, the body of this green candle must completely cover, or "engulf," the body of the previous red candle. This structure shows that all selling pressure from the previous period has been erased and surpassed by new buying volume. The visual dominance of the green candle over the red one marks a psychological turning point. It suggests that the bottom has likely been reached and a new upward trajectory may be forming.
Bearish Engulfing Dynamics
On the opposite end of the spectrum lies the bearish engulfing pattern. This formation appears at the peak of an uptrend and signals that the bulls have run out of steam. The first candle is green, indicating that the upward trend was still active. However, the second candle is a large red one that completely engulfs the body of the first green candle.
The psychology here is brutal for late buyers. The market may have opened higher, enticing traders to enter long positions. However, heavy selling immediately takes over, driving the price down below the previous period's open. This rapid shift traps bulls who bought the top and triggers stop-losses, which fuels further downside momentum. The larger the red candle relative to the green one, the stronger the bearish signal. If the red candle engulfs multiple preceding green candles, the signal is considered even more reliable.
Three-Candle Confirmation Structures
Moving further up the reliability scale, we encounter three-candle patterns. These formations are highly valued because they unfold over a longer timeframe, providing a more detailed picture of the reversal process. They typically consist of a trend candle, a moment of indecision, and a confirmation candle.
The Morning Star
The Morning Star is a bottoming pattern that resembles a "U" shape on the chart. It signals a gradual but decisive transition from bearish to bullish control. The first component is a long red candle, which confirms that bears are initially in charge and driving prices lower.
The second candle is the pivot point. It is a small-bodied candle, often referred to as a "star" or a "doji." This candle indicates indecision. The selling pressure has subsided, but buyers haven't fully taken over yet. The market is effectively pausing to catch its breath. The third candle delivers the resolution. It is a strong green candle that closes well into the body of the first red candle, ideally above the midpoint. This third candle confirms that the indecision has resolved in favor of the bulls. It validates the reversal and provides a clear signal to traders watching for a bottom.
The Evening Star
The Evening Star is the bearish equivalent, marking the top of a trend with an inverted "U" shape. It begins with a long green candle, showing that the uptrend is healthy and buyers are aggressive. This is followed by the small "star" candle, indicating that the upward momentum has stalled.
The appearance of this small middle candle is the first warning sign. It shows that despite the previous momentum, buyers could not push the price significantly higher. The third candle acts as the executioner of the trend. It is a long red candle that plunges down, closing below the midpoint of the first green candle. This confirms that sellers have seized control and that the previous uptrend has likely terminated. Traders often use the high of the middle "star" candle as a definitive resistance level for placing stop-losses.
The Psychology of Market Control
Understanding the psychology behind these patterns is more valuable than memorizing their shapes. Every candlestick tells a story of a battle between two opposing forces. The reliability framework depends on interpreting who won the battle and how decisively they won it.
Wick Analysis
The "wicks" or "shadows" of a candle are arguably the most important element in reading market psychology. A long wick represents a rejection of price. In a hammer, the long lower wick shows that sellers pushed price down, but buyers viewed that price as too cheap and bought it back up.
Conversely, a long upper wick, as seen in a Shooting Star, shows that buyers pushed price up, but sellers viewed it as too expensive and sold it back down. The length of the wick relative to the body is a direct measure of the rejection's strength. A short wick suggests mild resistance, while a massive wick suggests a violent rejection. Traders should look for wicks that are outliers compared to recent price action. These anomalies often mark significant turning points where value perception shifted instantly.
Body Analysis
The "real body" of the candle represents the ultimate outcome of the period's battle. It is the distance between the open and the close. A large body indicates strong conviction. If a candle opens and closes near opposite extremes, it means one side dominated the entire session.
Small bodies, like those found in the middle of Morning and Evening Stars, represent equilibrium. Neither buyers nor sellers could make significant progress. This equilibrium is often the calm before the storm. A transition from large bodies (trend) to small bodies (indecision) and back to large bodies (reversal) is the standard rhythm of a market turning point. Recognizing this rhythm helps traders anticipate changes before they become obvious trends.
Seznam za potrditev
Tudi najbolj popoln vzorec lahko zataji. V nestanovitnem svetu kriptovalut so lažni signali pogosti, zlasti v obdobjih nizke likvidnosti. Da bi izboljšali oceno zanesljivosti trgovalne nastavitve, morajo trgovci iskati konvergenco iz drugih tehničnih dejavnikov.
Validacija volumna
Volumen je gorivo, ki poganja tržne gibe. Vzorec obrata, ki se oblikuje pri nizkem volumnu, je sumljiv. Nakazuje, da je bil obrat cene povzročen zaradi pomanjkanja zanimanja, ne zaradi vala protizagona. Za visoko oceno zanesljivosti bi morala sveča obrata spremljati skok v trgovalnem volumnu.
Na primer pri bikovskem pokrivajočem vzorcu bi morala druga (zelena) sveča idealno pokazati višji volumen kot prva (rdeča) sveča. To potrjuje, da nov denar vstopa na trg za podporo rasti cen. Podobno streljajoča zvezda z visokim volumnom kaže, da se je na vrhu zgodila masivna prodaja, kar ustvari formidabilen nivo odpora. Če volumen pada, medtem ko se vzorec oblikuje, naj bodo trgovci previdni pred potencialno pastjo.
Potrditev naslednje sveče
Strpnost je vrlina tehnične analize. Eden najvarnejših načinov trgovanja teh vzorcev je počakati na 'potrditveno svečo'. To je sveča, ki takoj sledi vzorcu. Za bikovsko kladivo je potrditev zelena sveča, ki se zapre višje od zaprtja kladiva.
Ta dodatni korak zmanjša tveganje ulova padajočega noža. Če se oblikuje kladivo, vendar je naslednja sveča velika rdeča, ki prelomi dno kladiva, signal zataji. Obrat ni držal. Čakanje na potrditev pomeni vstop v trgovanje nekoliko kasneje in morda po slabši ceni, vendar drastično poveča stopnjo zmag z izločanjem zatajanih nastavitev. Na kripto trgih, kjer so lažni prehodi pogosti, je ta korak potrditve pogosto razlika med dobičkom in izgubo.
Risk Management within the Framework
No framework guarantees a 100% success rate. Therefore, defining risk is just as important as identifying the entry. Candlestick patterns provide natural levels for placing stop-loss orders, allowing traders to define their risk per trade precisely.
Stop-Loss Placement
The anatomy of the reversal pattern dictates the invalidation point. For a bullish pattern like a Morning Star or Hammer, the logical stop-loss is placed just below the lowest point of the pattern (the lower wick). If the price drops below this level, the structure of the reversal is broken. The buyers who stepped in at that level have been overrun, and the thesis for the trade is no longer valid.
For bearish patterns like the Shooting Star or Bearish Engulfing, the stop-loss goes above the highest wick of the formation. This high point represents the "line in the sand" where sellers successfully defended the price. If the market rallies back above this high, it means the bears have lost control, and the downtrend thesis is incorrect. Placing stops at these technical invalidation points removes emotion from the exit decision.
Interpreting False Signals
Markets are noisy, and patterns often fail. A "false signal" occurs when a pattern forms, but the price continues in the original direction. This is most common in strong trending markets where counter-trend trades are dangerous. For instance, a series of hammers might appear during a severe crash, only to be run over by continued selling.
This is why the "Trend Context" discussed earlier is vital. Trading against a strong trend (counter-trend trading) has a higher failure rate than trading a pullback within a trend. Traders should be skeptical of reversal patterns that appear in the middle of nowhere. If a pattern fails—meaning price breaks the invalidation level—traders must accept the loss immediately. Holding onto a failed trade hoping it will come back is a primary cause of capital destruction in crypto trading.
Primerjalno ocenjevanje zanesljivosti
Za pomoč pri hitrih odločitvah lahko trgovci kategorizirajo vzorce na podlagi njihove kompleksnosti in tipične zanesljivosti. Čeprav kontekst vedno vlada, vzorci s tremi svečami na splošno nudijo več notranjega potrdila kot vzorci s posamezno svečo.
| Tip vzorca | Struktura | Razpoloženje | Faktorji zanesljivosti |
|---|---|---|---|
| Kladivo / Streljajoča zvezda | Posamezna sveča | Zavrnitev | Potrebuje volumen & potrditev naslednje sveče |
| Bikovsko / Medvedje pokrivanje | Dve sveči | Premik zagona | Močnejše, če je drugo telo veliko |
| Jutranja / Večerna zvezda | Tri sveče | Obrat | Visoka; vključuje vgrajeno potrditev |
Ta hierarhija pomaga trgovcem razporediti kapital. Trgovec bi lahko stavil manjši znesek na nastavitev s posamezno svečo kladivo zaradi nižje notranje zanesljivosti. Nasprotno popolnoma oblikovana jutranja zvezda na podpornem nivoju lahko upraviči standardno ali večjo velikost pozicije, ker so več obdobij potrdila obrat.
Kombiniranje indikatorjev
Za najvišjo možno oceno trgovci kombinirajo sveče z indikatorji zagona, kot je relativni indeks moči (RSI) ali MACD (konvergenca/divergenca gibljivih povprečij). Bikovsko kladivo je močno, vendar je bikovsko kladivo, ki se pojavi, ko je RSI pregret navzdol (pod 30), bistveno močnejše.
Podobno je medvedje pokrivajoči vzorec bolj grozeč, če je RSI pregret navzgor (nad 70) ali kaže medvedjo divergenco. MACD lahko prav tako potrdi premike zagona; bikovski križ MACD hkrati z vzorcem jutranje zvezde nudi robusten dokaz za vstop v trgovanje. Te kombinacije ustvarijo 'konvergenco' signalov, ki je sveti gral trgovanja z visoko zanesljivostjo.
Conclusion
The Candlestick Reliability Framework provides a structured method for interpreting crypto market data. It moves traders away from the dangerous habit of impulsive gambling based on isolated shapes and towards a strategic, context-aware approach. By evaluating the trend, checking the location relative to support and resistance, and demanding volume confirmation, traders can filter out low-quality signals and focus on high-probability setups.
Whether identifying the rejection in a Shooting Star or the momentum shift in a Bullish Engulfing pattern, the key lies in the story the chart is telling. The patterns are simply the language of the market. Mastering this language requires patience, discipline, and a commitment to risk management. No pattern works every time, but using a graded framework ensures that traders are consistently aligning themselves with the highest probability outcomes.
Effective trading is not about predicting the future but about reacting to confirmed changes in market psychology.