
Bitcoin dominance is one of the most critical metrics for understanding the health and direction of the cryptocurrency market. It represents the percentage of the total cryptocurrency market capitalization that is held specifically in Bitcoin. Since the inception of the industry in 2009, Bitcoin has served as the primary benchmark for the entire digital asset ecosystem. For the first several years of its existence, Bitcoin essentially was the market, holding near-total dominance. As the industry has matured, thousands of alternative cryptocurrencies have emerged, diluting this percentage and creating a dynamic interplay between the market leader and the wider field of digital assets.
Investors watch this metric closely because it acts as a barometer for market sentiment. It reveals whether capital is flowing into the relative safety of the largest cryptocurrency or chasing higher-risk returns in smaller assets. When Bitcoin dominance is high or rising, it generally suggests a defensive market posture or the early stages of a bull run driven by institutional capital. Conversely, when dominance falls, it often signals an increase in speculative appetite, leading to what traders refer to as "altcoin season." Understanding these shifts allows market participants to identify which phase the market is currently traversing.
While price charts show the value of individual assets, dominance charts show the flow of capital between sectors. This distinction is vital for portfolio management. A rising Bitcoin price does not always mean dominance is rising if altcoins are growing faster. Similarly, a falling Bitcoin price can still result in rising dominance if altcoins are crashing harder. By analyzing these relative strengths, investors can make more informed decisions about risk exposure and asset allocation.
The Mechanics of the Metric
Calculation and Composition
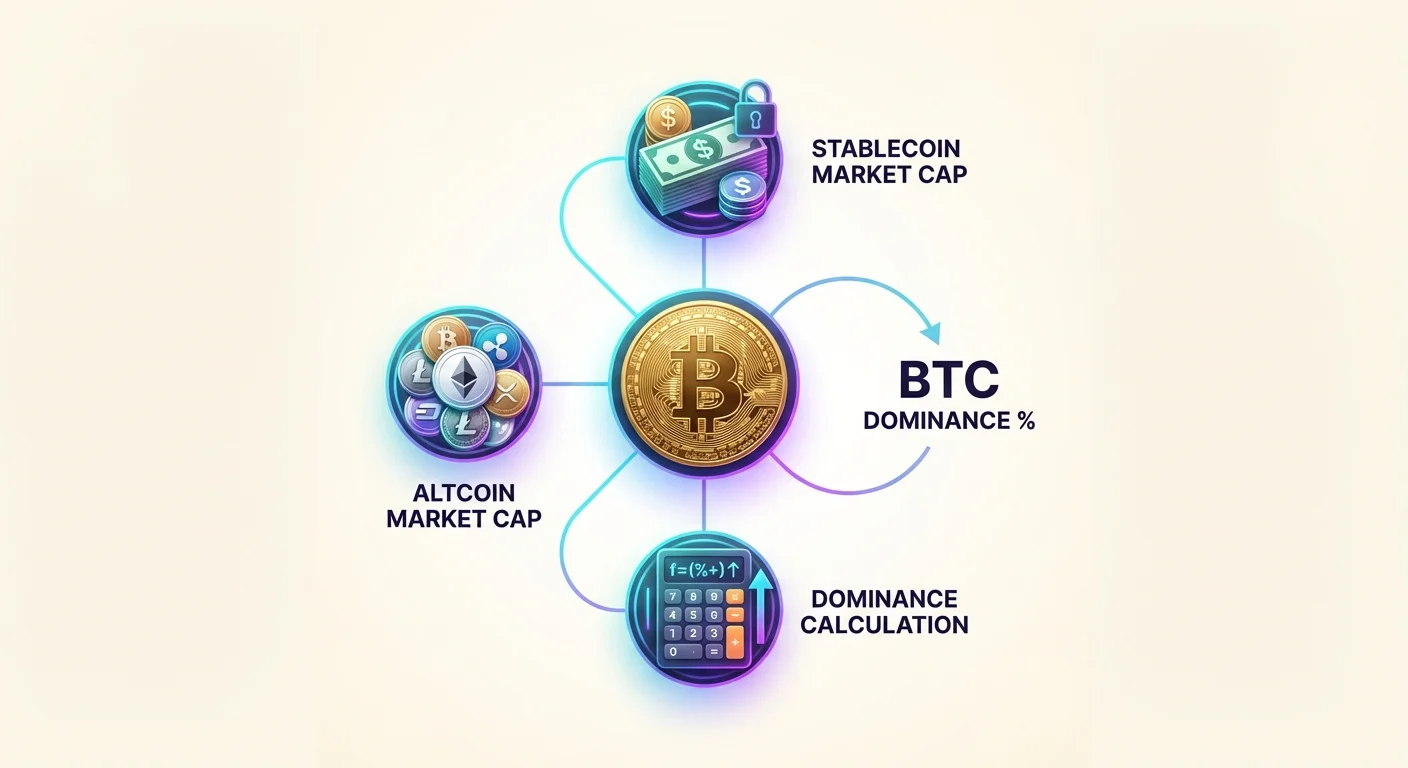
The formula for calculating Bitcoin dominance is straightforward yet powerful. It is derived by taking Bitcoin’s market capitalization and dividing it by the total market capitalization of all cryptocurrencies combined. The result is multiplied by 100 to produce a percentage. Market capitalization itself is calculated by multiplying the current price of a single unit by the total circulating supply. This means that changes in dominance can come from two sources: price movements or changes in circulating supply.
Because Bitcoin has a fixed supply cap of 21 million coins and a relatively predictable issuance schedule through halving events, its supply side is stable. In contrast, many alternative cryptocurrencies have variable inflation rates, aggressive token unlocks, or unlimited supplies. This difference makes price the primary driver of dominance fluctuations for Bitcoin, while supply dilution can heavily impact the market cap of smaller assets.
Data Aggregation Challenges
Calculating the total market cap of the crypto industry involves tracking thousands of different assets across hundreds of exchanges. This includes stablecoins, utility tokens, governance tokens, and meme coins. Data providers must aggregate prices and volume from centralized exchanges and decentralized platforms to get an accurate picture.
Variations in how different platforms calculate "circulating supply" versus "fully diluted value" can lead to slight discrepancies in dominance figures. However, the general trend lines remain consistent across major analytical tools. It is the trend direction, rather than the exact decimal point, that provides the most actionable value to traders and analysts.
Interpreting Market Phases
The Bitcoin Accumulation Phase
Market cycles often begin with a phase where Bitcoin dominance rises. This typically occurs after a significant market correction or during a prolonged bear market. During these periods, investor confidence is low, and risk tolerance is minimal. Capital flees from volatile, lower-cap assets and seeks the relative stability of Bitcoin.
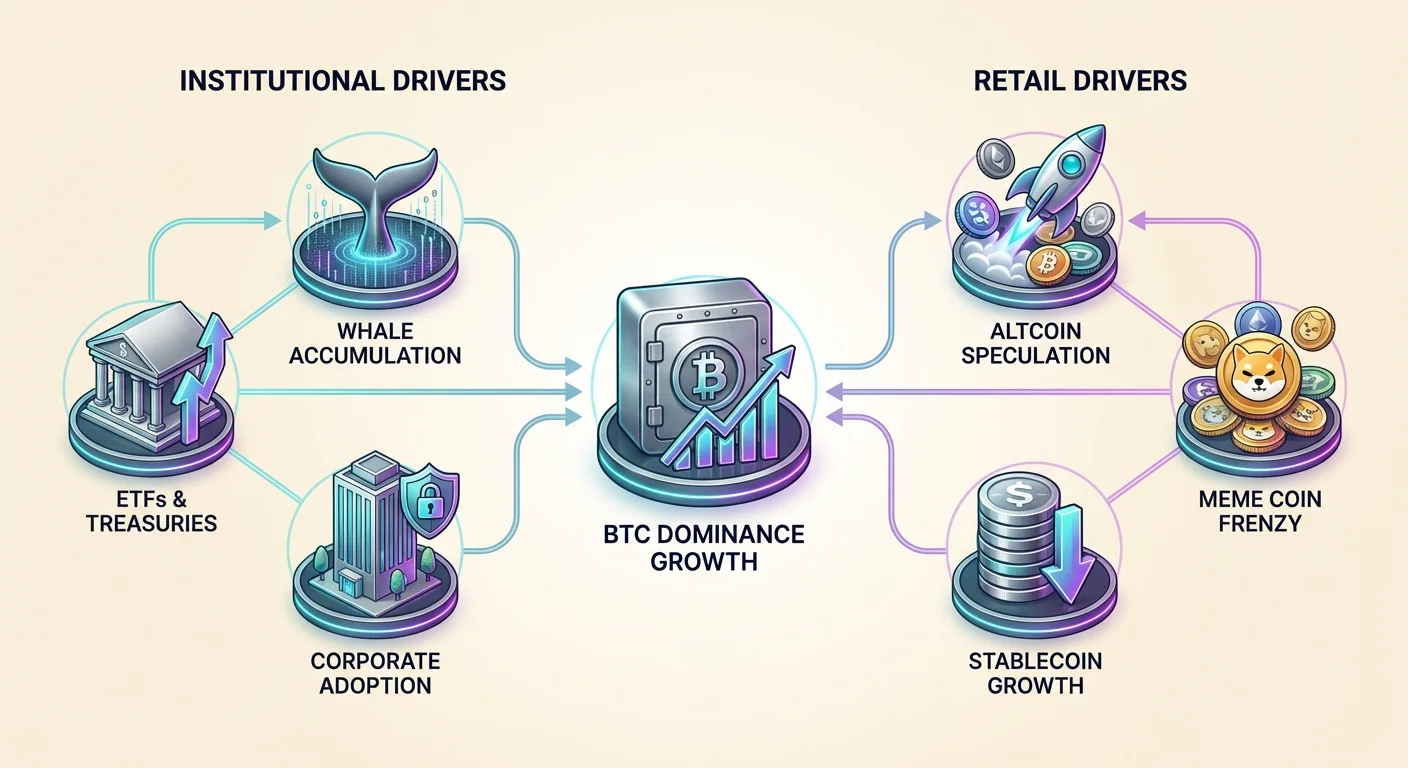
This phase is often characterized by "smart money" and institutional investors accumulating positions. Entities like corporate treasuries and large-scale whales tend to prefer Bitcoin due to its liquidity and regulatory status. As these large players enter the market, they drive up Bitcoin’s price and market cap relative to the stagnant or declining altcoin market.
The Altcoin Speculation Phase
As Bitcoin’s price rises and market sentiment shifts from fear to greed, the second phase usually begins. Early investors who have profited from Bitcoin’s rise begin to rotate capital into alternative cryptocurrencies in search of higher returns. This rotation causes Bitcoin dominance to peak and roll over.
During this period, often called "altcoin season," smaller assets frequently outperform Bitcoin by significant margins. The dominance chart will show a sharp downtrend even if Bitcoin’s price is still slowly rising or moving sideways. This indicates that new capital is bypassing the market leader or that existing capital is moving further out on the risk curve.
| Market Phase | Dominance Trend | Investor Behavior |
|---|---|---|
| Risk-Off / Bear | Rising | Flight to safety, exiting small caps |
| Early Bull | Rising | Institutional entry, capital flows to BTC |
| Altcoin Season | Falling | Profit rotation, high risk appetite |
Institutional Influence and Market Structure
The Role of ETFs and Treasuries
The introduction of spot Bitcoin Exchange-Traded Funds (ETFs) has fundamentally altered the market structure. These financial products open the door for traditional investment firms and retirement funds to gain exposure to Bitcoin without managing private keys. This institutional capital is typically mandated to stick to major, regulated assets, primarily Bitcoin.
Consequently, heavy inflows into ETFs can create sustained upward pressure on Bitcoin dominance. Unlike retail traders who might quickly flip profits into speculative tokens, institutional holders generally have longer time horizons. This structural buying supports Bitcoin’s market cap independent of the retail-driven altcoin market.
Corporate Adoption
Corporate treasuries also play a significant role in supporting Bitcoin dominance. Publicly traded companies that add digital assets to their balance sheets almost exclusively choose Bitcoin. They view it as a store of value and a potential hedge against inflation, similar to digital gold.
These corporate entities rarely diversify into smaller, riskier cryptocurrencies due to regulatory concerns and volatility risks. As more corporations adopt this strategy to protect their cash reserves, the demand for Bitcoin grows disproportionately to the rest of the market, reinforcing its dominant position.
Whale Activity and OTC Markets
Large-scale holders, known as whales, often execute trades over-the-counter (OTC) to avoid slippage on public order books. High-net-worth individuals and family offices utilizing OTC desks are typically focused on Bitcoin preservation. Their accumulation patterns can be tracked through on-chain analysis, often preceding shifts in dominance.
When whales are accumulating, Bitcoin dominance tends to find a floor. Conversely, when long-term holders begin distributing coins to retail buyers, it often marks the top of a Bitcoin-specific cycle, leading to the eventual rotation of funds into the broader market.
The Impact of Stablecoins
Dilution of Dominance
A unique factor in modern crypto markets is the rise of stablecoins. These assets are pegged to fiat currencies like the US dollar and are included in the total crypto market capitalization. As the supply of stablecoins grows, they mathematically reduce Bitcoin’s dominance percentage, even if Bitcoin’s price remains unchanged.
In 2017, stablecoins were a negligible part of the market. Today, they represent a massive portion of the industry's total value. This means that comparing current dominance levels to historical levels requires nuance. A lower Bitcoin dominance today does not necessarily mean altcoins are stronger; it may simply reflect the massive demand for digital dollars.
Dry Powder and Sideline Capital
Stablecoin market share acts as a different kind of sentiment indicator. When stablecoin dominance is high, it indicates that investors have exited volatile positions and are sitting in cash, waiting for an entry point. This is often referred to as "dry powder."
When this capital re-enters the market, it typically flows into Bitcoin first, causing a spike in dominance. Later, as confidence returns, that liquidity moves into riskier assets. monitoring the interplay between Bitcoin dominance and stablecoin dominance provides a clearer picture of total market liquidity than looking at Bitcoin alone.
Bitcoin vs. Gold: The Store of Value Narrative
Digital Gold and Market Confidence
Bitcoin is frequently compared to gold as a store of value. This narrative strengthens its position during times of macroeconomic uncertainty. When inflation rises or geopolitical tensions escalate, investors often look for non-sovereign assets. Gold has held this role for millennia, but Bitcoin is increasingly seen as the digital alternative.
This "flight to quality" dynamic boosts Bitcoin dominance during economic downturns. While altcoins are often viewed as tech stocks or venture capital bets, Bitcoin is viewed as a monetary commodity. This fundamental difference in perception means that external economic shocks tend to hurt altcoins more than Bitcoin, pushing dominance higher.
Asset Class Maturation
As Bitcoin matures as an asset class, its correlation with other assets shifts. It has begun to exhibit properties of both a risk-on asset and a safe-haven asset depending on the context. However, compared to the thousands of other crypto assets, it remains the conservative choice.
Regulatory clarity also favors Bitcoin. While many altcoins face scrutiny regarding their status as unregistered securities, Bitcoin is widely regarded as a commodity. This regulatory moat provides a level of safety for large allocators, ensuring that Bitcoin remains the center of gravity for the industry’s capitalization.
Analyzing Historical Trends
The 2017 Shift
Before 2017, Bitcoin dominance rarely fell below 80%. The Initial Coin Offering (ICO) boom changed this dynamic forever. Thousands of new tokens launched on the Ethereum network, attracting billions in speculative capital. Bitcoin dominance plummeted to historic lows near 35% in early 2018.
This period marked the structural transition from a one-asset market to a diverse ecosystem. However, the subsequent bear market saw dominance grind back up to over 70%. This illustrated the cyclical nature of the metric: altcoins explode in value during manias but evaporate during depressions, while Bitcoin retains value far better.
The DeFi and NFT Impact
The 2020-2021 cycle introduced Decentralized Finance (DeFi) and Non-Fungible Tokens (NFTs). These innovations gave altcoins utility beyond simple speculation. Ethereum, in particular, established itself as a foundational layer for the internet of value, securing a significant chunk of market share.
Despite this, Bitcoin dominance remains a relevant cycle indicator. Even with functional utility, altcoins remain highly correlated to Bitcoin’s price movements. They typically act as leveraged plays on Bitcoin, rising faster in uptrends and falling harder in downtrends.
Risks and Limitations
Not a Timing Tool
While valuable, Bitcoin dominance is not a precise timing tool. It is a lagging or coincident indicator rather than a leading one. A reversal in the dominance trend is often only visible after the market trend has already shifted. Traders should not use it in isolation to time tops or bottoms.
Furthermore, the metric can be noisy. A sudden crash in a major altcoin can artificially spike Bitcoin dominance, or a pump in a specific sector like meme coins can suppress it temporarily. It is essential to look at the broader trend over weeks and months rather than reacting to daily fluctuations.
The Ethereum Factor
Ethereum holds a unique position that complicates dominance analysis. As the second-largest asset, it often moves independently of both Bitcoin and smaller altcoins. Some analysts prefer to look at a "BTC+ETH Dominance" metric to gauge the health of the established market versus the speculative tail.
If Ethereum flips Bitcoin in market cap—a hypothetical event known as "The Flippening"—the relevance of Bitcoin dominance as a singular metric would be fundamentally challenged. For now, however, Bitcoin remains the primary driver of market cycles.
Strategic Application for Investors
Managing Risk Exposure
Investors can use dominance trends to adjust their risk exposure dynamically. When dominance is at multi-year highs, it may historically represent a good time to begin diversifying into high-quality altcoins, as the risk-reward ratio becomes favorable.
Conversely, when dominance hits multi-year lows, it often signals that the market is overheated and frothy. In this scenario, rotating profits back into Bitcoin or stablecoins can protect gains against the inevitable market correction. This counter-cyclical approach uses dominance as a guide for rebalancing.
Dollar-Cost Averaging (DCA)
Regardless of dominance levels, many investors stick to a strategy of Dollar-Cost Averaging (DCA). This involves buying a fixed dollar amount of Bitcoin at regular intervals. This strategy mitigates the risk of volatility and removes the need to predict dominance cycles perfectly.
For those with a diversified portfolio, DCA can be adjusted based on dominance. For example, an investor might allocate more heavy buys to Bitcoin when dominance is rising (confirming a safer trend) and allocate small amounts to altcoins only when dominance shows signs of topping out.
Conclusion
Bitcoin dominance remains one of the most enduring and useful indicators in the cryptocurrency space. It provides a high-level view of market psychology, indicating whether fear or greed is driving capital flows. By understanding the relationship between Bitcoin, altcoins, and stablecoins, investors can better navigate the volatile cycles of the digital asset economy. The metric encapsulates the battle between the stability of the market leader and the innovation and speculation of the broader ecosystem.
While the crypto landscape continues to evolve with new sectors and financial products, the gravitational pull of Bitcoin remains central. Whether through institutional adoption via ETFs or its role as a digital store of value, Bitcoin continues to dictate the tempo of the market. Monitoring dominance allows participants to align their portfolios with the prevailing market phase, managing risk while seeking opportunities.
Bitcoin dominance serves as a vital compass for navigating market cycles and managing portfolio risk effectively.