
Bitcoin’s journey from an obscure digital experiment in 2009 to a globally recognized financial asset is a story defined by extreme variance. For investors and analysts, understanding Bitcoin requires looking beyond its price appreciation to the underlying mechanics of its risk profile. Unlike traditional equities or commodities, Bitcoin operates within a decentralized framework that creates unique market behaviors. Its history is marked by dramatic rises and distinct correction phases that test the resolve of long-term holders.
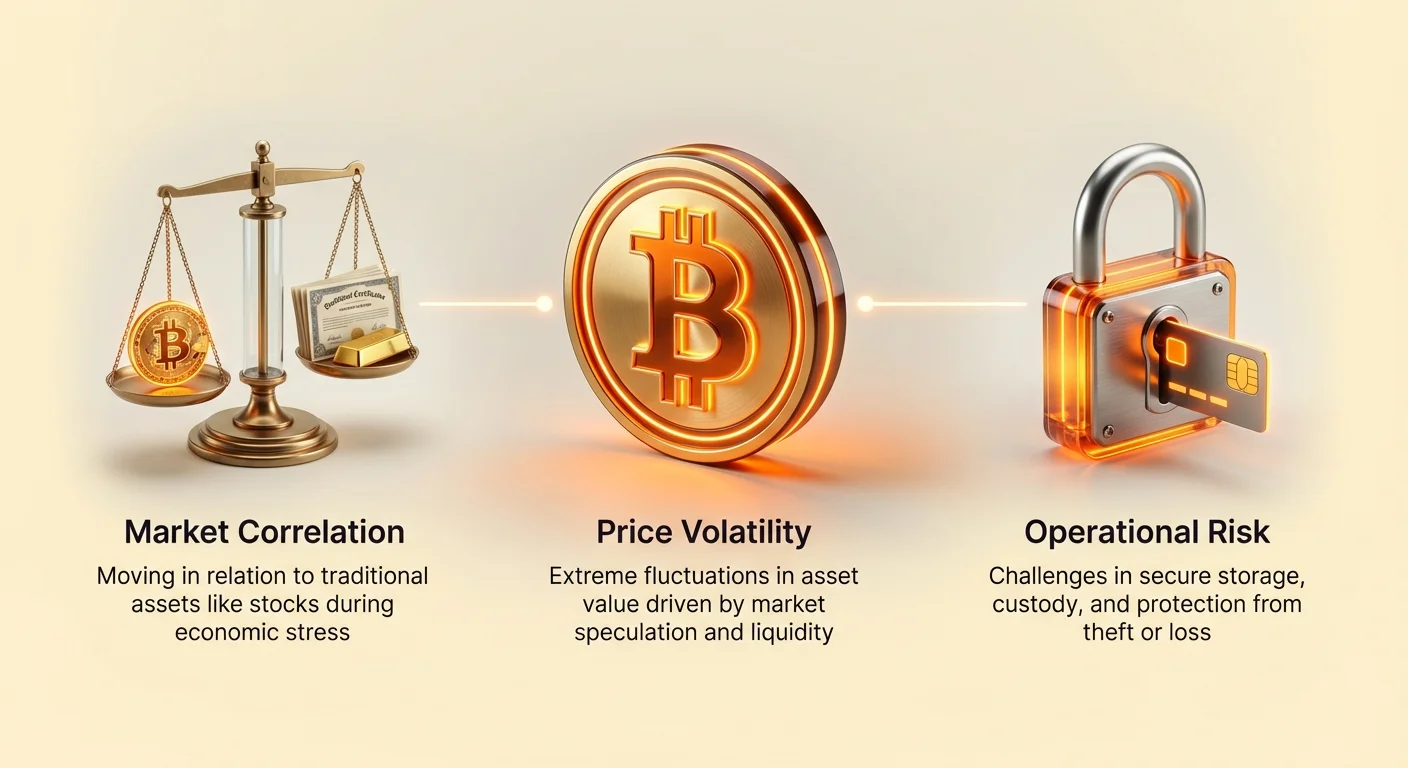
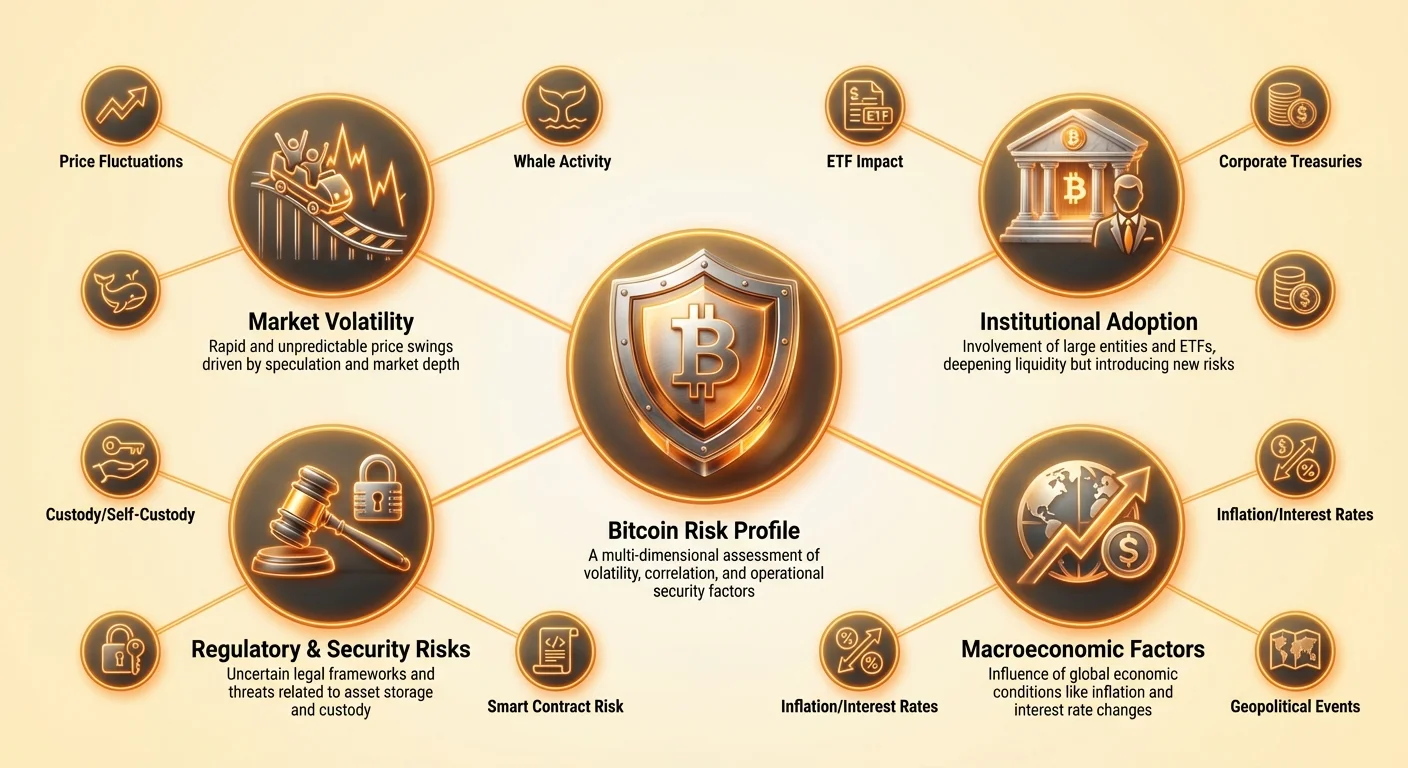
Assessing the risk of this asset class involves dissecting several interconnected metrics. Volatility remains the most prominent characteristic, often scaring away conservative capital while attracting high-frequency traders. However, volatility is only one piece of the puzzle. To truly understand the risk, one must analyze how Bitcoin correlates with other major asset classes like stocks and gold. This helps determine if it acts as a portfolio diversifier or merely amplifies existing market risks.
Furthermore, advanced metrics like the Sharpe ratio help quantify whether the potential returns justify the historical volatility. By examining market dominance, liquidity depth, and the impact of institutional adoption, we can build a comprehensive picture of Bitcoin’s investment landscape. This analysis moves beyond simple price predictions to evaluate the structural health and maturity of the network.
Historical Volatility and Market Cycles
Bitcoin’s price history offers the clearest data regarding its volatility profile. In the early years, specifically between 2009 and 2013, the asset experienced wild fluctuations that are rarely seen in mature markets. For instance, in 2011, the price surged to roughly $32 before crashing violently. These early bubbles were driven by a lack of liquidity and the speculative nature of a nascent technology. The market was thin, meaning small trades could cause massive price swings.
As the market matured, the nature of this volatility began to shift. The 2017 bull run saw Bitcoin climb to nearly $20,000, driven by retail frenzy and the initial coin offering (ICO) boom. This period highlighted a different type of risk associated with hype cycles and media attention. The subsequent crash in 2018, often called the "crypto winter," saw prices drop by over 80 percent. This drawdown period served as a harsh lesson in market cycles for new entrants.
The Modern Era of Volatility
The 2020-2021 cycle introduced new variables to the volatility equation. Driven by macroeconomic factors like the COVID-19 pandemic and inflation concerns, Bitcoin reached new highs exceeding $68,000. While still volatile, the market depth had improved significantly compared to 2013. The presence of larger entities and more robust exchanges helped absorb some of the selling pressure, though sharp corrections remained a staple of the asset's behavior.
Analyzing Correlation with Traditional Assets
A critical component of risk assessment is determining how an asset moves in relation to the broader market. For years, Bitcoin was viewed as an uncorrelated asset, meaning its price movements had little to do with the stock market or the economy. This lack of correlation was a primary selling point for portfolio diversification. Investors believed that if stocks crashed, Bitcoin might hold its value or move independently, providing a safety net.
However, this narrative has evolved as institutional money has entered the space. During periods of extreme economic stress or liquidity crises, Bitcoin has shown a tendency to correlate more tightening with risk-on assets like technology stocks. When the Nasdaq fluctuates due to interest rate changes, Bitcoin often mirrors those moves. This increasing correlation challenges the idea that Bitcoin is purely a non-correlated diversifier during short-term market panics.
The Gold Comparison
Conversely, the "digital gold" narrative suggests a correlation with precious metals. Gold is a time-tested store of value known for stability and inflation protection. Bitcoin shares the scarcity property of gold, with a hard cap of 21 million coins, but lacks its historical stability. While gold reacts slowly to market changes, Bitcoin reacts aggressively. Over long time horizons, proponents argue that Bitcoin’s purchasing power preservation aligns with gold, even if daily correlations remain low.
| Characteristic | Bitcoin | Gold |
|---|---|---|
| Supply Limit | Fixed (21 Million) | Inflationary (Mining) |
| Transportability | High (Digital) | Low (Physical) |
| Volatility | High | Low |
| Verifyability | Cryptographic | Physical Testing |
The Role of Bitcoin Dominance
Bitcoin dominance is a metric that measures Bitcoin’s market capitalization as a percentage of the total cryptocurrency market. This figure is a vital risk indicator for the sector. When Bitcoin dominance is high, it typically signals a "flight to quality" within the crypto ecosystem. During bear markets or uncertain times, capital tends to flow out of riskier, smaller-cap altcoins and back into Bitcoin, which is perceived as the safest digital asset.
Conversely, when Bitcoin dominance falls, it often indicates a "risk-on" appetite where investors are seeking higher returns in alternative cryptocurrencies. This phenomenon, often called "alt season," represents a period of higher overall market risk. A falling dominance metric suggests that speculative fervor is increasing, as investors move capital further out on the risk curve to chase yield or growth in less established projects.
Monitoring dominance trends helps investors gauge the general sentiment of the crypto market. If Bitcoin holds a massive share of the market, the ecosystem is likely in a consolidation or defensive phase. If that share erodes rapidly, it suggests a speculative mania is underway. Understanding this dynamic is crucial for managing exposure, as altcoins historically suffer much deeper drawdowns than Bitcoin during market corrections.
Institutional Adoption and Liquidity Risks
The entry of institutional players has fundamentally altered Bitcoin’s risk profile. The approval and launch of Bitcoin Exchange-Traded Funds (ETFs) in various jurisdictions, including the United States, have provided a regulated bridge for traditional capital. ETFs allow investors to gain exposure to Bitcoin’s price movements without managing private keys or navigating unregulated exchanges. This influx of capital generally deepens liquidity, which can dampen volatility over time.
However, institutionalization introduces new risks. When traditional finance (TradFi) entities like hedge funds and public corporations hold significant amounts of Bitcoin, the asset becomes more intertwined with the legacy financial system. Decisions made by corporate treasuries or ETF managers can have outsized impacts on price. For example, if a major corporation faces a cash crunch and needs to liquidate its Bitcoin treasury, the selling pressure could be immense.
Counter-Party and Product Risk
Investors using ETFs or custodial solutions accept counter-party risk. They do not own the underlying Bitcoin directly; they own a claim on it. This reintroduces the risk of third-party failure, which the original ethos of Bitcoin sought to eliminate. While regulated ETFs offer bankruptcy protections that unregulated exchanges do not, they still distance the investor from the core property of censorship resistance found in self-custody.
Whale Activity and Market Manipulation
In the cryptocurrency ecosystem, "whales" are individuals or entities that hold massive quantities of Bitcoin. Because the market is relatively smaller than global forex or equity markets, these large holders possess the power to move prices significantly. If a whale decides to sell a large block of coins on a standard exchange, the sudden increase in supply can crash the price locally, triggering a cascade of liquidations for leveraged traders.
Tracking whale activity through on-chain analysis has become a standard part of risk management. Blockchain transparency allows analysts to see when large amounts of Bitcoin move from cold storage wallets to exchanges. Such movements are often interpreted as a signal of intent to sell, prompting pre-emptive selling by smaller traders. This game of cat-and-mouse creates short-term volatility that is unique to the transparent nature of public ledgers.
To mitigate the impact on price, large players often utilize Over-The-Counter (OTC) trading desks. OTC trading occurs directly between two parties, bypassing public order books. This allows institutions to buy or sell millions of dollars worth of Bitcoin without immediately shifting the market price. While this stabilizes the spot price, it reduces transparency, as retail traders may not be aware of significant ownership changes until after they occur.
Sharpe Ratio and Risk-Adjusted Returns
The Sharpe ratio is a financial metric used to understand the return of an investment compared to its risk. It is calculated by subtracting the risk-free rate from the return of the portfolio and dividing the result by the standard deviation of the portfolio's excess return. In simpler terms, it tells an investor if the high returns of an asset are actually worth the stress of the volatility they must endure.
Bitcoin has historically displayed a high Sharpe ratio over multi-year periods. Despite its notorious 80 percent drawdowns, the magnitude of its upside rallies has been sufficient to compensate for the variance. For example, an asset that drops 50 percent but gains 300 percent in the following year may offer a better risk-adjusted return than an asset that stays flat with zero volatility.
However, the Sharpe ratio is not static. In short timeframes, particularly during bear markets, Bitcoin’s Sharpe ratio can turn negative. This indicates that holding cash or risk-free bonds would have been a superior strategy. Assessing this ratio requires a long-term time preference. Investors analyzing Bitcoin through this lens must accept that the "risk" (volatility) is the price paid for the "reward" (outsized appreciation).
Operational and Custodial Risks
Beyond market mechanics, Bitcoin carries unique operational risks related to storage and ownership. The mantra "not your keys, not your coins" highlights the danger of leaving assets on centralized exchanges. History is littered with examples of exchange collapses, most notably the Mt. Gox disaster in 2014, where a dominant platform failed, resulting in the loss of hundreds of thousands of coins.
The Self-Custody Dilemma
Self-custody eliminates the risk of exchange failure but introduces personal responsibility risk. If a user loses their private key or seed phrase, the funds are irretrievable. There is no customer support to reset a password. This absolute responsibility can be a barrier for some and a significant risk factor for those not technically proficient. Malware, phishing attacks, and physical theft of hardware wallets are constant threats.
Multisig Solutions
To mitigate these single points of failure, shared wallets (multisig) have emerged as a robust solution. These wallets require multiple approvals to authorize a transaction. For example, a 2-of-3 setup might require signatures from a phone, a hardware device, and a trusted family member. This structure is crucial for corporate treasuries and high-net-worth individuals, as it prevents a single compromised key from leading to a total loss of funds.
Inflation and Macroeconomic Factors
The narrative of Bitcoin as a hedge against inflation is central to its risk profile. Traditional fiat currencies can be printed in unlimited quantities by central banks, leading to the devaluation of purchasing power over time. Bitcoin’s protocol dictates a strict supply cap of 21 million units, with the issuance rate decreasing every four years via the "halving" event. This predictable monetary policy is designed to make Bitcoin disinflationary.
Investors often treat Bitcoin as a check against fiscal irresponsibility. When inflation metrics rise, capital often seeks hard assets. However, Bitcoin’s reaction to inflation is not always linear. In times of rapid inflation accompanied by rising interest rates, Bitcoin may suffer along with other liquidity-dependent assets. High interest rates make borrowing expensive and strengthen the fiat currency, often causing a retreat from speculative assets.
The risk here lies in the misalignment of expectations. If an investor buys Bitcoin solely as a short-term inflation shield, they may be disappointed if macroeconomic tightening crashes all asset prices simultaneously. The inflation hedge property is best observed over extended periods, where the contrast between expanding fiat supplies and Bitcoin’s fixed supply becomes mathematically undeniable.
Conclusion
Assessing Bitcoin’s risk profile requires a multi-dimensional approach that considers volatility, correlation, and operational security. The asset has evolved from a highly speculative experiment into a recognized component of the global financial landscape. Its volatility, while reduced compared to its earliest days, remains a defining feature that offers both opportunity for high returns and the danger of significant drawdowns.
The interplay between Bitcoin and traditional finance continues to deepen through ETFs and corporate adoption. While this brings liquidity and legitimacy, it also ties Bitcoin closer to macroeconomic trends and equity market correlations. Investors must weigh the benefits of censorship resistance and fixed supply against the realities of market manipulation, regulatory uncertainty, and the technical demands of self-custody.
Risk in the Bitcoin ecosystem is not merely about price going down; it is a function of market maturity, liquidity depth, and security practices.