
Kad jauni dalībnieki ienāk kripto telpā, sarunas bieži grozās ap cenu vēsturi un volatilitāti. Tomēr, lai integrētu digitālos aktīvus, piemēram, Bitcoin, sarežģītā investīciju stratēģijā, ir nepieciešama dziļāka kvantitatīvā analīze. Mums jāpāriet tālāk par vienkāršu Bitcoin cenas pieauguma salīdzināšanu ar zelta vai akciju tirgus pieaugumu. Tā vietā mums jānovērtē tā matemātiskā saikne ar tradicionālajām finansēm.
Šai kvantitatīvajai pieejai ir nepieciešami divi kritiski rādītāji: korelācija un Beta (). Šie rādītāji ļauj investoriem noteikt, cik cieši Bitcoin cenas kustības seko S&P 500, Nasdaq vai citiem tradicionāliem indeksiem. Šo saikņu izpratne ir būtiska efektīvai risku pārvaldībai, portfeļa veidošanai un Bitcoin lomas kā potenciāla makro aizsarga validēšanai.
Šis ceļvedis sniedz detalizētu, rādītāju vadītu ietvaru Bitcoin korelācijas indeksa un Beta vērtības aprēķināšanai un interpretācijai. Pieņemot investīciju analītiķa skatupunktu, jūs iemācīsities kvantificēt riskus un diversifikācijas priekšrocības, ko Bitcoin piedāvā modernā portfelī.
Pamats: Korelācijas un diversifikācijas izpratne
Tradicionālajās finansēs diversifikācija ir risku pārvaldības pamats. Diversificēta portfeļa mērķis ir turēt aktīvus, kas visi nepārvietojas tajā pašā virzienā vienlaikus. Korelācija un Beta ir rīki, ko izmanto, lai mērītu šo kustību.
Korelācijas definēšana vienkāršos terminus
Korelācija mēra pakāpi, kādā divi dažādi aktīvi pārvietojas kopā. Tā tiek izteikta kā koeficients diapazonā no -1.0 līdz +1.0.
| Korelācijas vērtība | Saikne | Interpretācija |
|---|---|---|
| +1.0 (Ideāla pozitīva) | Aktīvi pārvietojas perfekti sinhroni. | Kad Akts A pieaug par 5%, Akts B pieaug par 5%. |
| 0.0 (Nulle korelācija) | Aktīviem nav lineāras saiknes. | Akts A pārvietojas neatkarīgi no Akta B. |
| -1.0 (Ideāla negatīva) | Aktīvi pārvietojas perfekti pretēji. | Kad Akts A pieaug par 5%, Akts B samazinās par 5%. |
Ja Bitcoin būtu korelācija +1.0 ar S&P 500, Bitcoin pievienošana akciju portfelim nesniegtu nekādas diversifikācijas priekšrocības — tas tikai pastiprinātu esošo tirgus risku. Investori meklē aktīvus ar korelācijas koeficientiem tuvu nullei vai ideāli negatīviem.
Portfeļa diversifikācijas mērķis
Diversificējot, jūs mērķējat samazināt kopējo portfeļa volatilitāti, nezaudējot potenciālos ienākumus. Ja viena aktīvu klase (piemēram, akcijas) veicas slikti, cita aktīvu klase (piemēram, obligācijas vai potenciāli Bitcoin) veicas labi vai vismaz paliek stabila.
Bitcoin ilgtermiņa investīciju teorija bieži balstās uz ideju, ka tas ir nekorelēts aktīvs — digitāli rets preces, kas darbojas ārpus tradicionālās fiat naudas sistēmas. Korelācijas indeksu analīze ļauj pārbaudīt šo teoriju pret reāliem tirgus datiem.
Correlation Analysis: How Bitcoin Relates to Traditional Assets
Analyzing Bitcoin’s correlation requires context. Unlike traditional asset classes where relationships might remain stable for decades (e.g., stocks vs. bonds), Bitcoin’s relationship with major market indices is highly dynamic and changes depending on market sentiment, liquidity, and macroeconomic events.
Calculating the Correlation Index (Rolling 90-Day Analysis)
A simple, static correlation calculation (e.g., BTC correlation over the last 10 years) can be misleading. Bitcoin’s maturity level and market structure have changed dramatically since its inception. Therefore, analysts rely on rolling correlation indices.
The most common method is the Rolling 90-Day Correlation. This involves:
- Calculating the daily returns for Bitcoin (BTC) and the chosen benchmark (e.g., the S&P 500, or the tech-heavy Nasdaq Composite).
- Taking the last 90 days of returns and calculating the correlation coefficient.
- Repeating this calculation every day, effectively creating a moving average of correlation.
This rolling analysis reveals crucial shifts in market structure. For example, during periods of extreme financial stress (like the COVID-19 market crash in March 2020), assets tend to move toward a correlation of +1.0 as investors panic and liquidate everything to raise cash. Analysts call this a "risk-off" environment where correlation converges.
Interpreting Correlation Values ( and $0$)
Over its history, Bitcoin has demonstrated significant shifts in its correlation profile:
- Low/Zero Correlation (Early Years & Deep Bear Markets): During periods when the institutional ownership of BTC was low, its price action was largely driven by internal crypto adoption cycles (e.g., halving events, technological upgrades). Its correlation with the Nasdaq was often close to 0. This supported the diversification thesis.
- High Positive Correlation (Periods of Institutional Integration): Following the widespread adoption of regulated financial products (like Bitcoin ETFs and futures contracts), Bitcoin began to trade alongside major technology and growth stocks. When the S&P 500 performs well, Bitcoin often amplifies that performance (correlation moves toward +0.5 to +0.8). It trades as a "risk-on" asset.
Case Study: BTC vs. S&P 500 (Historical Shifts)
To visualize this, consider the correlation between Bitcoin and the S&P 500:
- 2017 – 2020: Correlation hovered near 0.1 to 0.3. Bitcoin was viewed as an exotic, niche asset largely separate from global macro trends.
- 2021 – 2022: Correlation surged to 0.6 – 0.8 during peak liquidity. Increased institutional involvement meant BTC became subject to the same interest rate and liquidity fears that governed tech stocks. When the Federal Reserve raised rates, both the Nasdaq and Bitcoin suffered simultaneously.
- Post-2023: Correlation often recedes back toward 0.4 or 0.5. Analysts watch for these de-correlation events, as they signal a renewed acceptance of Bitcoin as a unique asset class rather than just another high-beta tech stock.
Bitcoin Beta: Measuring Volatility Relative to the Market
While correlation measures the direction of movement between two assets, Beta () measures the magnitude of that movement relative to a specific benchmark, usually the broader stock market (S&P 500).
Beta is the definitive measure of an asset’s systematic risk—the non-diversifiable market risk that affects all assets.
What is Beta ()? (The Formula Explained Simply)
Conceptually, Beta is calculated by dividing the covariance of the asset (Bitcoin) and the benchmark (S&P 500) by the variance of the benchmark.
This calculation tells us, mathematically, how sensitive Bitcoin is to broad market movements.
The Benchmark’s Beta is always 1.0. If Bitcoin has a Beta of 2.0 against the S&P 500, it means that for every 1% move in the S&P 500, Bitcoin is expected to move 2% in the same direction.
Interpreting a High Beta (\beta > 1): The Risk Amplifier
When Bitcoin’s Beta is significantly greater than 1.0, it confirms its role as a "risk-on" asset.
Key Interpretation:
- \beta > 1.0 (High Beta): Bitcoin is more volatile and sensitive than the overall market. If the stock market rallies, Bitcoin is expected to rally even harder. Conversely, if the stock market falls, Bitcoin is expected to fall further.
- Example: If Bitcoin's Beta against the S&P 500 is 2.5, and the S&P 500 rises 4% in a quarter, Bitcoin is expected to rise 10% (4% x 2.5).
Historically, Bitcoin’s Beta has often been between 1.5 and 3.0, especially when measured against indices that contain high-growth technology stocks, such as the Nasdaq Composite. This volatility premium is what attracts many investors, but it also means Bitcoin greatly increases the overall systematic risk of a portfolio.
Interpreting Negative or Zero Beta (): The Macro Hedge
The holy grail for diversification—and the strongest argument for Bitcoin as a true "digital store of value" similar to gold—is a Beta close to zero or, ideally, negative.
Key Interpretation:
- (Zero Beta): Bitcoin’s price movements are independent of the broader market. Adding zero-Beta assets reduces the overall systematic risk of the portfolio.
- \beta < 0 (Negative Beta): Bitcoin moves inversely to the market. When the market is under stress (falling), Bitcoin is expected to rise. This is the definition of a true macro hedge.
- Example: US Treasury bonds often exhibit a negative Beta relative to the stock market, rising in value when investors flee equities.
Bitcoin has rarely sustained a consistently negative Beta. The brief periods where its Beta drops toward zero often coincide with extreme monetary policy uncertainty or localized crypto events (like regulatory milestones or technological forks) that overshadow global macro trends. Sustained negative Beta remains the aspirational goal for the full validation of the store-of-value thesis.
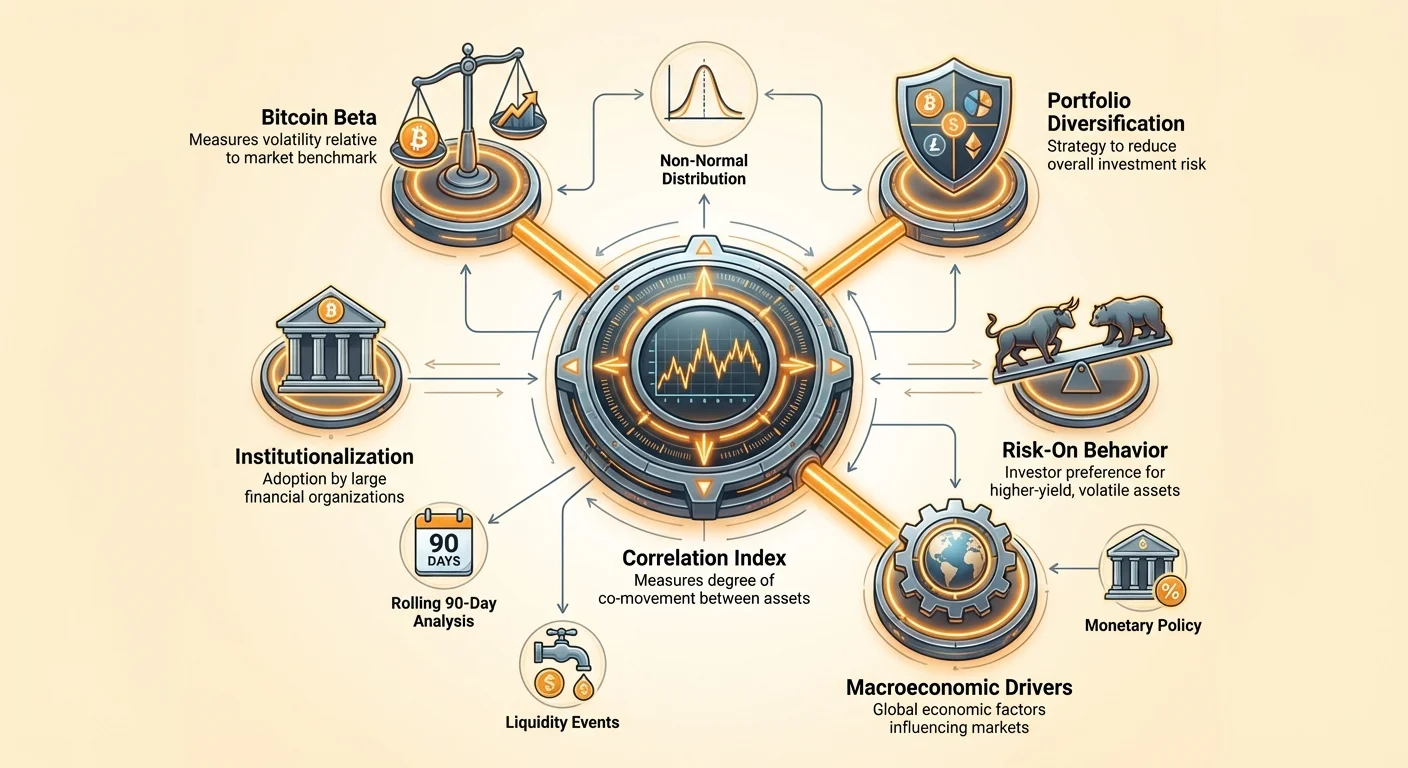
Drivers of Correlation and De-correlation
Bitcoin's Beta and correlation are not static. They shift based on underlying market structure and macroeconomic forces. Understanding the drivers of these shifts is key to anticipating future performance.
Institutionalization and "Risk-On" Behavior
The primary driver increasing Bitcoin’s correlation with traditional markets is institutionalization.
- Regulated Products (ETFs and Futures): When Bitcoin is primarily bought through traditional vehicles like exchange-traded funds (ETFs) and futures contracts, it enters the portfolio models of massive institutions, including pension funds and corporate treasuries.
- Asset Class Classification: These institutions typically classify BTC not as a separate currency, but as a "high-growth, long-duration technology asset." This places it in the same risk bucket as the major tech stocks that dominate the Nasdaq and S&P 500.
- Liquidity Events: When fund managers need to raise cash quickly, they sell their most liquid, high-risk assets first. If Bitcoin is in the "high-risk" bucket alongside tech stocks, both will be sold simultaneously, driving correlation toward +1.0.
Macroeconomic Drivers (Inflation, Monetary Policy)
Macroeconomics play a decisive role in correlation shifts:
- Tighter Monetary Policy: When central banks raise interest rates, liquidity tightens. This universally hurts speculative, long-duration assets (like growth stocks and Bitcoin) because their future cash flows are discounted more steeply. This environment pushes correlation higher.
- Geopolitical and Systemic Risks: When major geopolitical conflicts or global banking crises occur, correlation can spike briefly toward 1.0. However, if the crisis challenges the stability of the fiat system itself, Bitcoin may eventually de-correlate, rising as a safe-haven alternative.
Market Maturation and De-correlation Events
As the market matures, there are specific factors that could drive de-correlation (pushing correlation toward zero):
- Increased Use as Currency: If a significant portion of Bitcoin’s volume shifts from speculative trading to transactional use (Layer 2 payment systems, remittances), its price will be driven by utility and network effects rather than general market risk sentiment.
- Sovereign Adoption: If a nation-state begins using Bitcoin as part of its treasury reserves or monetary policy, the asset's price dynamics will become linked to sovereign stability rather than corporate profitability, potentially reducing Beta against equity markets.
- The Store-of-Value Narrative: For Bitcoin to achieve sustained low correlation, the market must unanimously agree that it functions primarily as a digital commodity, valued for its scarcity and independence from central banking, rather than a speculative tech stock.
Praktiska pielietošana: Beta izmantošana portfeļa riska novērtēšanai
Bitcoin Beta un korelācijas indeksu izpratne nav tikai akadēmisks vingrinājums; tas ir būtiski Bitcoin optimālās piešķiršanas aprēķināšanai diversificētajā portfelī.
Optimālās portfeļa piešķiršanas noteikšana
Finanšu profesionāļiem un nopietniem mazumtirdzniecības investoriem šie rādītāji tiek izmantoti Vidējās-variances optimizācijas (MVO) veikšanai — metodei aktīvu izvēlei, lai maksimizētu gaidāmo ienesīgumu noteiktam riska līmenim.
1. Diversifikācijas vērtības kvantificēšana
Ja jūsu portfeļa esošais sistemātiskais risks (mērīts ar tā kopējo Beta) ir augsts, aktīva pievienošana ar zemu vai negatīvu korelāciju var ievērojami samazināt kopējo volatilitāti, neietekmējot gaidāmos ienesīgumus būtiski.
- Rīcībspējīgs ieskats: Ja slīdošā 90 dienu BTC korelācija ar S&P 500 paaugstinās virs 0.7, diversifikācijas ieguvums ir samazināts un mazāka piešķiršana ir pamatota sistemātiskā riska pārvaldībai. Ja korelācija nokrīt zem 0.3, lielāka piešķiršana var būt pamatota uzlabotas diversifikācijas dēļ.
2. Riska budžeta plānošana, balstīta uz Beta
Ja jūs nolemjat iekļaut Bitcoin (ar tā augsto Beta, piem., ), jums jāsamazina piešķiršanas procentuāli ievērojami salīdzinājumā ar zema Beta aktīvu, piemēram, obligācijām (\beta<0.5).
- Analītiķa perspektīva: 5% piešķiršana Bitcoin ar Beta 2.5 veido tādu pašu sistemātiskā riska daudzumu portfelī kā 12.5% piešķiršana standarta tirgus sekojošā fondā (5% x 2.5 = 12.5%). Šī izpratne ļauj veikt precīzu riska budžeta plānošanu.
Bitcoin Beta metrikas ierobežojumi un brīdinājumi
Lai gan spēcīgs, Beta pielietošana Bitcoin rada unikālus izaicinājumus, kurus investoriem jāatzīst:
1. Ne-normāls izplatījums
Tradicionālie finanšu modeļi pieņem, ka aktīvu ienesīgumi seko normālam izplatījumam (zvanveida līkne). Tomēr Bitcoin ienesīgumi ir slaveni ar «resnām astīm», kas nozīmē, ka ekstremālas kustības (uz augšu vai leju) notiek daudz biežāk, nekā paredz normālais modelis. Beta aprēķini, balstīti uz standartnovirzi un kovarianci, var nenovērtēt patieso ekstremālo krituma risku, kas raksturīgs Bitcoin.
2. Laika jutīgums
Kā jau noteikts, Beta un korelācija nav stabilas. 5 gadu Beta aprēķins var rādīt augstu vērtību, bet, ja tirgus struktūra fundamentāli mainījās pirms 18 mēnešiem (jaunu regulējumu vai ETF apstiprinājuma dēļ), ilgtermiņa Beta ir nerelevants nākotnes kustību prognozēšanai. Investoriem jāizmanto īsāki, slīdošie 90 dienu vai 180 dienu rādītāji.
3. Likviditāte un darījumu izmaksas
Beta modeļi parasti pieņem nepārtrauktu likviditāti. Lai gan Bitcoin ir augsti likvids, ekstremāla stresa periodos var rasties plašāki spredi un augstākas darījumu izmaksas nekā tradicionālajām akcijām, kas smalki ietekmē reālās pasaules sniegumu, ko norāda aprēķinātais Beta.
Secinājums
Bitcoin evolūcija no neskaidras interneta valūtas uz globāli atzītu aktīvu prasa, lai investori pieņemtu kvantitatīvo finanšu stingros rīkus. Aiz anekdotiskiem salīdzinājumiem ir nepieciešama detalizēta, ripoša korelācijas indeksu un Beta analīze.
Aprēķinot un uzraugot Bitcoin Beta pret galvenajiem tradicionālajiem etaloniem, piemēram, S&P 500 un Nasdaq Composite, investori var precīzi izmērīt sistēmisko risku, ko Bitcoin pievieno portfelim. Lai gan Bitcoin vēsturiski demonstrē augstu Beta (), signalizējot tā pašreizējo statusu kā izaugsmes/risk-on aktīvu, de-korelācijas vadītāju izpratne — piemēram, tirgus briedums un lietderības adopcija — ir galvenā, lai paredzētu, vai Bitcoin galu galā īstenos savu potenciālu kā zema Beta makro aizsargs pret monetāro nestabilitāti.
Ceļā uz finanšu pašsuverenitāti kvantitatīvā analīze sniedz nepieciešamo ietvaru, lai spekulācijas aktīvus pārvērstu stratēģiski pārvaldītos portfeļa komponentos.