
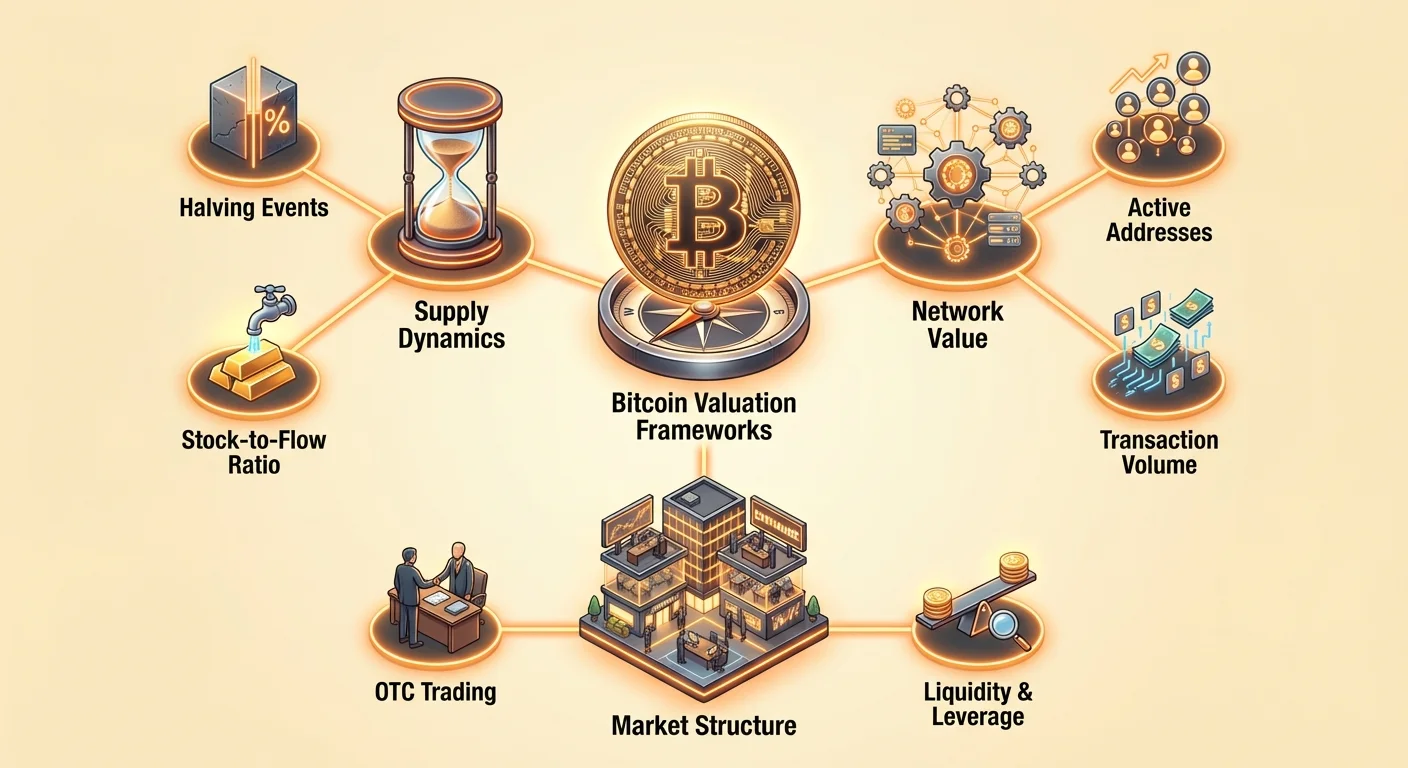
Bitcoin represents a unique challenge for investors attempting to determine its fair market value. Unlike traditional equities, it produces no quarterly earnings reports, offers no dividends, and generates no cash flow to plug into a discounted cash flow model. It functions without a central bank to manage its supply or a CEO to provide forward guidance. Consequently, analysts and investors have had to develop entirely new frameworks to assess whether the asset is overvalued or undervalued at any given moment.
These valuation models largely rely on data derived directly from the blockchain. Because every Bitcoin transaction is recorded on a public ledger, observers can analyze the movement of funds, the cost basis of holders, and the activity level of the network in real time. This granular data allows for the creation of sophisticated metrics that track supply dynamics, investor behavior, and network utility.
Understanding these frameworks helps investors move beyond simple price speculation. By examining the underlying mechanics of supply and demand, one can gain a clearer picture of the asset's health. This requires looking at Bitcoin not just as a ticker symbol on an exchange, but as a monetary network with programmable scarcity and verifiable adoption metrics.
The Scarcity Model and Supply Dynamics
The most prominent valuation narrative for Bitcoin revolves around its scarcity. The protocol has a hard cap of 21 million coins, a feature that distinguishes it sharply from fiat currencies that can be printed without limit. This fixed supply schedule creates a predictable inflation rate that decreases over time. digital scarcity
Every four years, an event known as the "halving" cuts the reward for mining new blocks in half. This effectively reduces the flow of new Bitcoin entering the market by 50 percent. As the issuance rate drops, the asset becomes harder to produce, mimicking the extraction curve of precious metals like gold.
This dynamic forms the basis of scarcity-based valuation models. These frameworks often compare the existing stock of an asset (the total supply) to its flow (the new annual production). A high ratio indicates that the existing supply is large relative to new production, which typically implies a store of value.
In the early years, Bitcoin's inflation rate was high to bootstrap the network. However, as halving events occur, the inflation rate drops significantly. Eventually, the new supply rate falls below 2 percent and continues toward zero. This increasing scarcity suggests that if demand remains constant or grows, the price must appreciate to accommodate the reduced inflow of new coins.
Comparisons to Precious Metals
Gold has historically served as the benchmark for scarcity. Its low supply increase is dictated by the difficult physical process of extracting ore, processing it, and distributing it. The annual supply growth of gold has historically hovered around very low percentages. Bitcoin is designed to undercut this rate mathematically.
This comparison drives the "digital gold" narrative. Investors view Bitcoin as a modern alternative that offers the same monetary soundness as gold but with added technological benefits. These include portability, divisibility, and verifiable authenticity without the need for heavy industrial infrastructure.
Where gold requires assays and physical storage, Bitcoin can be verified by running a node and stored on a USB drive or a piece of paper. This utility, combined with mathematical scarcity, suggests that Bitcoin's market capitalization could eventually rival that of gold as investors seek reliable stores of value.

Analyzing Realized Capitalization
Standard market capitalization is calculated by multiplying the current price of a single unit by the total circulating supply. While this is a standard metric for stocks, it can be misleading for cryptocurrencies. It assumes that every coin in existence is being valued at the current marginal trading price.
This approach fails to account for coins that have been lost, forgotten, or held for years in cold storage. It also ignores the fact that different investors bought in at vastly different price levels. To solve this, analysts use a metric known as Realized Capitalization.
Realized Cap calculates the total value of the network by pricing each individual Unspent Transaction Output (UTXO) at the price it was last moved. Instead of valuing all coins at the current price, it values them at their "book value" or cost basis. This provides a more accurate aggregate of what the market actually paid for its holdings.
interpreting Market vs. Realized Value
Comparing the standard Market Cap to the Realized Cap offers profound insights into market sentiment. When the Market Cap is significantly higher than the Realized Cap, it suggests that current participants are in profit. This often occurs during bull markets when euphoria drives the marginal price up rapidly.
Conversely, when the Market Cap falls below the Realized Cap, it indicates that the average holder is underwater. The aggregate market value is less than what investors paid for their coins. Historically, these periods have signaled market bottoms and accumulation zones, as weak hands capitulate and long-term holders accumulate.
This relationship helps filter out the noise of daily volatility. It focuses on the psychological state of the market participants. By understanding the aggregate cost basis, investors can gauge the potential selling pressure from holders looking to break even versus the profit-taking behavior of those sitting on massive gains.
Corporate Treasuries and Cost Basis
The concept of cost basis has moved from theoretical on-chain metrics to corporate balance sheets. Publicly traded companies have begun adding Bitcoin to their corporate treasuries as a reserve asset. For these entities, the acquisition price is a matter of public record and regulatory reporting.
Under traditional accounting rules, Bitcoin is often treated as an intangible asset. Companies record it at the purchase price and may have to mark it down if the price drops, but they cannot mark it up until they sell. This accounting treatment emphasizes the importance of the entry price.
When large entities like Tesla or Block acquire Bitcoin, they establish significant support levels at their cost basis. These corporate treasury strategies validate the asset class and reduce the available supply for retail traders. This institutional accumulation aligns with the Realized Cap logic, where the price at which coins are moved from exchanges to long-term cold storage becomes a critical valuation floor.
Network Value and Transaction Metrics
While scarcity focuses on supply, other frameworks focus on demand and utility. Bitcoin is a payment network, and its value should theoretically scale with its usage. This approach draws inspiration from Metcalfe's Law, which states that the value of a network is proportional to the square of the number of its users.
Metrics that track network value often look at the volume of transactions settled on the blockchain. If the network is processing billions of dollars in value daily, it suggests a high utility. Conversely, if the price is high but transaction volume is low, the asset might be overvalued based on pure speculation rather than actual use.
Analysts examine the ratio of the network's market value to the daily transaction volume flowing through it. A low ratio suggests that the network is undervalued relative to the utility it provides. A high ratio might indicate that the price has outpaced the underlying economic activity of the chain.
Active Addresses and Adoption Curves
Transaction volume is just one piece of the puzzle. The number of active addresses—unique wallets sending or receiving funds—serves as a proxy for user adoption. A growing number of active participants indicates a strengthening network effect.
Adoption does not happen in a straight line. It tends to follow an S-curve, with slow initial growth followed by exponential expansion and finally saturation. Bitcoin's price history often mirrors this adoption curve, with explosive cycles of growth driven by new waves of users entering the ecosystem.
Tracking the growth of non-zero balance wallets helps distinguish between genuine adoption and short-term trading noise. Long-term valuation models assume that as long as the user base continues to expand, the value of the network will rise over time. This metric is particularly useful for comparing Bitcoin's growth trajectory to the historical adoption of the internet or mobile phones.
Layer 2 and Scalability Valuation
The valuation of the network is also evolving with technological upgrades. The base layer of Bitcoin prioritizes security and decentralization, which limits transaction throughput. However, scaling solutions like the Lightning Network allow for faster, cheaper transactions off-chain.
Valuation models are beginning to incorporate the capacity and activity of these Layer 2 solutions. As more value moves to secondary layers for daily payments, the base layer solidifies its role as a high-value settlement network. This reinforces the "store of value" thesis while allowing utility to grow without clogging the main blockchain.
The development of these technologies increases the total addressable market for Bitcoin. It allows the asset to function simultaneously as a pristine collateral asset and a medium of exchange. This dual utility supports higher valuation projections than if Bitcoin were solely a slow settlement layer.
The Impact of Liquidity and Market Structure
Valuation is also heavily influenced by the structure of the market itself. The price of Bitcoin is determined across a fragmented landscape of centralized exchanges, decentralized platforms, and Over-The-Counter (OTC) trading desks. Understanding where trades happen is crucial for assessing the strength of a price movement.
Liquidity refers to the ease with which an asset can be bought or sold without affecting its price. In the crypto market, liquidity can vary drastically between exchanges. Low liquidity environments can lead to high volatility, where relatively small orders cause massive price swings.
Whales and institutional investors often utilize OTC desks to execute large block trades. These transactions happen privately and do not immediately hit the public order books. This means that a significant portion of Bitcoin's economic activity occurs beneath the surface, invisible to casual observers watching standard exchange charts.
OTC Trading and Price Discovery
OTC trading creates a divergence between public price action and institutional accumulation. If whales are buying heavily OTC, the supply on exchanges may drain without an immediate price spike. Eventually, this supply shock translates into upward price pressure as exchange liquidity dries up.
This dynamic makes exchange reserves a vital metric for valuation. When the balance of Bitcoin held on exchanges falls, it suggests that investors are moving coins to self-custody or cold storage. This reduces the available supply for sale, creating a bullish setup for price appreciation.
Conversely, when large inflows of Bitcoin hit exchanges, it often signals an intent to sell. Valuation models that track exchange flows can predict potential sell-side pressure before it manifests in price action. This flow data provides a leading indicator for market direction.
Derivatives and Leverage
The modern Bitcoin market is also heavily influenced by derivatives, such as futures and options. These financial instruments allow traders to speculate on the price with leverage, borrowing funds to amplify their positions. The valuation of Bitcoin in the short term is often driven by the mechanics of these Crypto Derivatives Explained.
When leverage builds up to unsustainable levels, it can lead to cascading liquidations. A small price drop triggers a chain reaction of forced selling, pushing the price down further. These "flush outs" reset the market valuation to a level more aligned with spot demand.
Analysts look at funding rates and open interest to gauge the health of the market. High open interest combined with high funding rates usually indicates an overheated market. A healthy valuation uptrend is typically supported by spot buying rather than excessive leverage.
Macroeconomic Correlations
Bitcoin does not exist in a vacuum. Its valuation is increasingly tied to the broader global economy. Initially, Bitcoin was uncorrelated with traditional assets, moving to its own internal rhythm. However, as institutional adoption has grown, so has its correlation with macroeconomic factors.
Inflation rates, central bank interest rate policies, and global liquidity cycles now play a significant role in Bitcoin pricing. When central banks expand the money supply, scarce assets like Bitcoin tend to appreciate. It acts as a hedge against monetary debasement, similar to how investors treat real estate or commodities.
Valuation frameworks now consider the "global liquidity" metric. This measures the total amount of fiat currency available in the financial system. Bitcoin has shown a strong tendency to rise when global liquidity is expanding and consolidate when liquidity is contracting.
| Valuation Factor | Primary Driver | Metric to Watch |
|---|---|---|
| Scarcity | Supply Schedule | Stock-to-Flow / Halving Cycles |
| Cost Basis | Investor Behavior | Realized Cap / MVRV Ratio |
| Utility | Network Usage | Transaction Volume / Active Addresses |
Investment as a Safe Haven
The narrative of Bitcoin as a safe haven is a key component of its long-term valuation. During times of geopolitical instability or banking crises, investors often seek assets outside the traditional financial system. Bitcoin's censorship resistance and decentralization make it an attractive option in these scenarios.
This quality adds a "monetary premium" to the asset. It is not just valued for what it can buy, but for its ability to protect wealth from seizure or devaluation. This component of value is difficult to quantify but is clearly visible during specific crisis events where Bitcoin outperforms local currencies.
Comparing Bitcoin to other safe-haven assets helps frame its potential market cap. If Bitcoin captures even a fraction of the market share held by gold or offshore banking deposits, its valuation per unit would be substantially higher than current levels. This "total addressable market" approach is a common method for projecting long-term value.
Whale Activity and Distribution
The distribution of Bitcoin ownership offers clues about its maturity and valuation. "Whales" are entities that hold large amounts of Bitcoin. Their behavior can significantly impact market trends. Tracking whale wallets allows analysts to see if smart money is accumulating or distributing.
In the early days, ownership was concentrated among a few miners and developers. Over time, supply has dispersed to millions of users. However, whales still control a significant portion of the supply. When whales move funds to exchanges, it is often a bearish signal. When they withdraw to cold storage, it is bullish.
Valuation models often look at "cohort analysis," which groups holders by the size of their wallets and the age of their coins. A healthy market is characterized by older coins remaining dormant (HODLing) while new demand absorbs the selling from miners.
Institutional Whales and ETFs
The entry of Exchange Traded Funds (ETFs) has created a new class of institutional whales. These funds purchase Bitcoin to back the shares they sell to investors. The transparency of ETF holdings provides a clear daily signal of institutional demand.
ETF inflows represent new capital entering the ecosystem from traditional finance channels. This structural demand supports the valuation by creating a consistent bid in the market. It also dampens volatility to some degree, as these buyers often have longer time horizons than retail speculators.
The shift from retail-driven cycles to institutional-driven cycles changes how valuation models work. Institutional capital is often stickier but more sensitive to interest rates and macroeconomic conditions. Understanding the behavior of these large entities is now essential for accurate valuation.
Conclusion
Valuation frameworks for Bitcoin have evolved from simple price speculation to complex models based on on-chain data and macroeconomic relationships. By combining metrics of scarcity, realized capitalization, and network utility, investors can navigate the volatility of the crypto market with greater confidence. No single metric tells the whole story, but together they provide a comprehensive view of the asset's fundamental health.
The interplay between supply dynamics, investor cost basis, and network adoption defines the fair value of Bitcoin. As the asset matures and integrates further into the global financial system, these models will likely become even more refined. Understanding the difference between price and value remains the ultimate edge for any investor in the digital asset space.
The true value of Bitcoin is found in the convergence of mathematical scarcity, verifiable adoption, and immutable security.