
Decentralized protocols like Bitcoin are often judged solely by their market capitalization, yet this single financial metric fails to capture the true health, utility, and technical success of the network. To truly understand whether a protocol upgrade or a scaling solution is successful, observers must analyze on-chain data, node adoption rates, and the distribution of economic activity. Bitcoin is not a static system; it evolves through a process of consensus building, where developers propose changes and the network participants decide whether to adopt them. To understand this process, read about the mechanics of Bitcoin governance.
Evaluating these changes requires a shift in perspective from price action to technical adoption. When a new feature is introduced, such as a privacy enhancement or a throughput increase, its success is determined by how widely it is integrated by wallets, exchanges, and miners. If a protocol upgrade exists in the code but is rarely utilized by the network participants, it cannot be considered a functional success. Therefore, robust metrics for measuring protocol health focus on the depth of integration and the tangible utility derived from these technical advancements.
The landscape of Bitcoin metrics has expanded significantly with the introduction of Layer 2 solutions, sidechains, and complex scripting capabilities. Analysts now track everything from the volume of off-chain computations to the number of digital artifacts inscribed directly onto the blockchain. By examining these specific data points, stakeholders can determine if the network is scaling effectively and if it is retaining its core properties of decentralization and security while expanding its feature set.
The Metrics of Consensus and Node Upgrades
Understanding Activation Thresholds
The primary metric for any proposed upgrade to the Bitcoin protocol is the consensus threshold. Bitcoin governance is not a democracy with a formal voting system; rather, it relies on a mechanism of rough consensus and technical signaling. Before a change becomes active, it typically undergoes a rigorous process involving Bitcoin Improvement Proposals (BIPs). The success of a proposal is first measured by the support it gathers during the drafting and peer review stages.
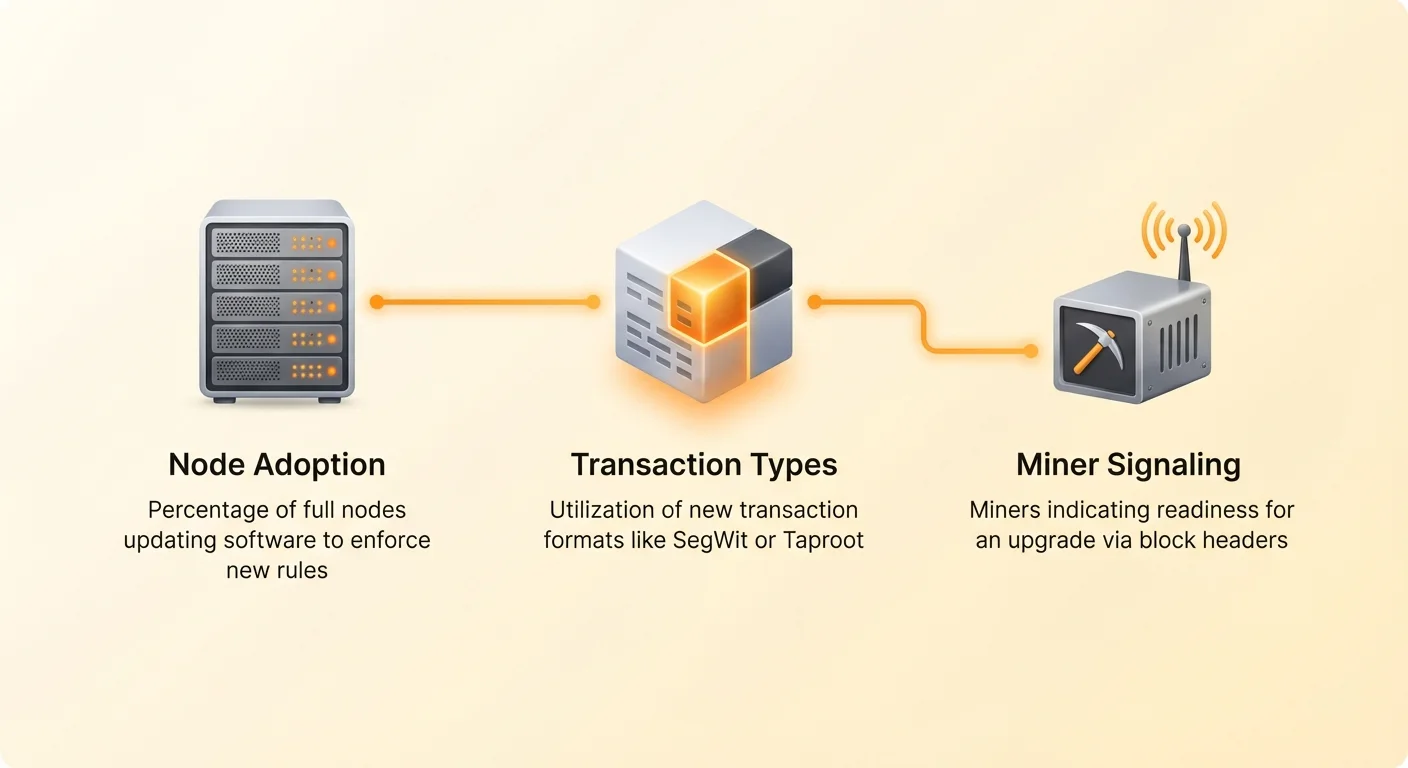
Once a proposal reaches the implementation stage, the network looks for specific on-chain signals. For soft forks, which are backwards-compatible upgrades, success is often defined by a supermajority of miners signaling readiness within a specific difficulty epoch. For example, the activation of Segregated Witness (SegWit) required 95 percent of miners to signal support during a fixed two-week period. Monitoring these signaling bits in block headers provides the earliest quantitative data regarding the industry's willingness to accept a change. For a detailed history on protocol changes, see the guide on Bitcoin's network splits and controversies.
However, miner signaling is only half of the equation. The ultimate metric for activation success is the percentage of full nodes that update their software to enforce the new rules. If miners signal for an upgrade but the economic majority of nodes—operated by exchanges, wallets, and users—refuse to install the compatible software, the upgrade may fail or lead to a contentious chain split. Therefore, tracking the version distribution of the global node network is a critical adoption metric, demonstrating how network participants uphold protocol rules.
Analyzing Soft Fork Adoption Curves
After an upgrade is technically activated, the next phase of measurement involves analyzing the adoption curve of the new transaction types. A soft fork enables new features without forcing all users to upgrade immediately. Consequently, the usage of new features often starts low and grows over time as wallet providers and service infrastructure integrate the changes.
This gradual adoption is a key indicator of ecosystem health. A healthy upgrade shows a steady, upward trend in the percentage of transactions utilizing the new format. Stagnation in this metric might indicate that the upgrade is technically complex to implement for developers or that it does not offer sufficient economic incentives for users to switch from legacy formats.
Analysts visualize this data by charting the ratio of new transaction outputs against legacy outputs over months and years. This creates a clear picture of the "stickiness" of an upgrade. If the usage spikes initially but then tapers off, it suggests novelty rather than utility. Sustained growth, on the other hand, confirms that the upgrade has solved a genuine problem for the network's participants.
The Impact of User-Driven Governance
Adoption metrics are also influenced by the method of activation. The history of Bitcoin includes moments where user signaling played a decisive role, such as the User Activated Soft Fork (UASF) movement. In scenarios where miner incentives diverge from user desires, the success of an upgrade can be measured by the number of nodes enforcing specific rules independent of hashrate signaling.
This dynamic highlights the opt-in nature of the protocol. Success in this context is measured by the economic weight behind the nodes enforcing the new rules. If the majority of economic activity—deposits, withdrawals, and commerce—occurs on nodes enforcing a specific upgrade, miners are economically incentivized to follow suit to avoid mining invalid blocks.
This interplay creates a measurable feedback loop between node counts and hashrate distribution. Tracking the migration of hashrate from non-compliant pools to compliant pools during a contentious upgrade period provides real-time data on the shifting consensus. It demonstrates that the ultimate authority in the protocol rests with the users who give the tokens value, rather than the miners who secure the history.
Assessing Base Layer Efficiency Upgrades
Segregated Witness Utilization
Segregated Witness (SegWit), implemented in 2017, fundamentally changed how data is stored in a block, aiming to fix transaction malleability and increase throughput. Learn more about SegWit and transaction efficiency. Measuring the success of SegWit involves tracking the percentage of transactions that segregate the witness data (signatures) from the transaction data.
Before SegWit, all data was counted equally against the 1MB block size limit. SegWit introduced the concept of "block weight," allowing a theoretical maximum of 4MB of data if all transactions are optimized. The primary metric here is the adoption rate of SegWit-compatible addresses (starting with "3" or "bc1"). High adoption rates correlate directly with more efficient block space usage and lower fees for users.
Analysts also look at the "witness ratio" of blocks. A block filled with SegWit transactions will have a different data footprint than a legacy block. By analyzing the average block weight over time, observers can determine if the network is maximizing the capacity benefits provided by the upgrade. Persistent low adoption would imply that the ecosystem is failing to leverage available efficiency gains.
Taproot and Privacy Metrics
The Taproot upgrade, activated in November 2021, introduced Schnorr signatures and Merkelized Abstract Syntax Trees (MAST). These features unlock advanced privacy and complex scripting. These technologies were designed to improve privacy and efficiency by making complex transactions indistinguishable from simple ones. The success metric for Taproot is often tracked via the prevalence of Pay-to-Taproot (P2TR) outputs.
One of Taproot's main goals is to enhance privacy by obscuring the differences between multi-signature setups and single-signature transactions. Therefore, a rising percentage of P2TR inputs suggests that more users and protocols are taking advantage of these privacy features. However, if P2TR usage remains negligible, it indicates a lag in wallet software development or a lack of user demand for on-chain privacy tools.
Another nuanced metric is the reduction in transaction size for multi-signature operations. Because Schnorr signatures allow for key aggregation, multiple signers can produce a single signature. This reduces the data burden on the blockchain. Measuring the average size of inputs in bytes before and after Taproot adoption provides concrete evidence of the upgrade's efficiency impact.
Transaction Malleability and Fee Markets
A successful base layer upgrade often aims to solve technical debt, such as transaction malleability. While difficult to measure directly as a volume metric, the success of fixing malleability is evidenced by the stability and reliability of Layer 2 implementations. Without the malleability fix provided by SegWit, the Lightning Network would be unsafe to operate.
Therefore, the growth of Layer 2 solutions serves as a proxy metric for the success of the underlying malleability fixes. If the base layer was still malleable, off-chain protocols would face significant theft risks and would likely not see meaningful capital deployment. The existence of a functional fee market on Layer 2 is proof that the base layer repairs were effective.
Additionally, fee efficiency is a critical success indicator. Upgrades like SegWit and Taproot aim to make transactions cheaper for the same amount of economic security. Analysts track the average fee paid per byte of data. A declining trend in cost-per-byte, even during periods of high network activity, signals that the upgrades are functioning as intended by allowing users to do more with less block space.
Evaluating Layer 2 Scaling Performance
Lightning Network Capacity and Reach
The Lightning Network is Bitcoin's primary Layer 2 solution for scalability, utilizing state channels to enable instant, low-cost payments. We analyze Lightning Network adoption metrics and liquidity. The most common metric for measuring its success is total network capacity—the aggregate amount of Bitcoin locked in payment channels. A rising capacity indicates that users are confident enough to lock their capital into the Layer 2 protocol.
However, capacity alone is insufficient. Analysts also measure the node count and channel count. A robust network requires a dense mesh of connections to ensure payments can find a route from sender to receiver. If capacity grows but the node count stagnates, it suggests centralization where only a few large hubs control the liquidity. A healthy graph shows growth in both total BTC locked and the number of active participants.
Another vital metric is channel longevity. Short-lived channels may indicate technical instability or poor economic incentives for routing nodes. Conversely, long-standing channels suggest a stable and reliable payment graph. Monitoring the average age of open channels provides insight into the maturity of the Lightning ecosystem.
Throughput and Routing Success
Unlike on-chain transactions, Lightning payments are private and not visible on the public blockchain. This makes measuring transaction throughput challenging. Observers often rely on data from routing nodes that voluntarily share their activity logs to estimate global volume. Success is defined by the ability to route payments successfully without failure.
Routing failure rate is a negative metric that developers aim to minimize. If a user attempts to send a payment and it fails because of a lack of liquidity along the path, the protocol is failing to deliver on its promise. High success rates for payments of various sizes indicate ample liquidity and efficient pathfinding algorithms.
Liquidity distribution is also key. A balanced network has inbound and outbound liquidity spread across many nodes. Metrics that track the "Gini coefficient" of the Lightning Network can reveal if liquidity is becoming too centralized. A lower Gini coefficient implies a more decentralized and resilient network topology.
State Channel Efficiency
State channels work by updating balances off-chain and only settling the final state on-chain. The efficiency of this system can be measured by the ratio of off-chain transactions to on-chain settlements. If two parties transact thousands of times off-chain and only broadcast two transactions (open and close) to the main chain, the scaling factor is massive.
Analysts attempt to estimate this "scaling multiplier" to judge the efficacy of the Layer 2 solution. A high multiplier confirms that the network is successfully offloading congestion from the main blockchain. If channels are opening and closing frequently with few interim transactions, the efficiency gains are lost, and the cost of using the Layer 2 solution rises.
Measuring Sidechain and Bridge Adoption
Two-Way Peg Utilization
Sidechains like the Liquid Network and Rootstock offer alternative environments for Bitcoin transactions, often enabling faster settlement or smart contracts. The connection between the main chain and a sidechain is the two-way peg. The primary metric for sidechain success is the volume of "peg-ins" (moving BTC to the sidechain) versus "peg-outs" (moving back).
A healthy sidechain should see a steady flow of assets entering the ecosystem. Total Value Locked (TVL) in the peg is a standard metric for gauging user trust. Since sidechains often have different security models than the main chain—such as federations or merge mining—a high TVL indicates that the market views the trade-off between security and functionality as acceptable.
Conversely, rapid periods of peg-outs (withdrawals) can signal a loss of confidence in the sidechain's security or a lack of utility for the assets once they are there. Monitoring the net flow of BTC across the bridge provides a real-time sentiment analysis of the sidechain's value proposition.
Smart Contract Deployment and Activity
Many sidechains, such as Rootstock, are compatible with the Ethereum Virtual Machine (EVM), allowing for smart contracts on Bitcoin. Success here is measured by the number of active contracts and the diversity of decentralized applications (dApps) deployed. A sidechain with high TVL but zero active dApps is merely a storage vault, not a computing layer.
Metrics include the number of daily active users interacting with contracts and the transaction volume of tokens other than the native peg. For instance, if a sidechain hosts stablecoins or lending protocols, the velocity of these assets is a strong indicator of economic vitality.
Developer activity is also crucial. The number of unique smart contracts deployed month-over-month highlights the attractiveness of the platform to builders. A growing developer ecosystem typically precedes a growing user base, making this a leading indicator of future success.
Merge Mining Hashrate
For sidechains that rely on merge mining (like Rootstock) or blind merged mining (like Drivechain proposals), security is derived from the Bitcoin miners who choose to process the sidechain's blocks simultaneously. The critical metric here is the percentage of total Bitcoin hashrate that is actively mining the sidechain.
If only a small fraction of Bitcoin miners participate, the sidechain's security is low, making it vulnerable to attacks. High participation rates indicate that miners view the sidechain as a valuable source of additional revenue and are willing to support its infrastructure.
This metric also serves as a proxy for miner alignment. If miners consistently support a sidechain, it suggests a symbiotic relationship where the scaling solution benefits the security providers of the base layer.
Tokenization and Cross-Chain Metrics
Wrapped Bitcoin Market Dominance
Wrapped Bitcoin refers to tokenized representations of BTC on other blockchains, primarily Ethereum. The success of these assets is measured by their dominance in the DeFi sector. WBTC, for example, is a custodial token, making it important to understand its architecture and custody risks. Its success is tracked by its total supply and its penetration into lending protocols and decentralized exchanges (DEXs).
Analysts compare the market capitalization of various wrapped versions, such as WBTC, tBTC (Threshold Bitcoin), and cbBTC (Coinbase Wrapped Bitcoin). A diversification of market share suggests a maturing ecosystem where users have options ranging from fully custodial to decentralized bridges.
The "utilization rate" of wrapped assets is another key metric. It is not enough for the tokens to exist; they must be used. High utilization of wrapped BTC as collateral in lending protocols indicates that Bitcoin is successfully serving as a pristine collateral asset in the broader crypto economy.
Decentralization of Bridges
Not all wrapped assets are created equal. Evaluating the success of a bridge protocol requires analyzing its decentralization. For tBTC, which uses a decentralized set of node operators, metrics include the number of active stakers and the diversity of the signer set.
The "N-of-M" signature threshold is a technical metric that defines security. It measures how many signers must collude to compromise the funds. A higher threshold generally implies better security. Monitoring the stability of the signer set—ensuring nodes are not dropping offline frequently—is essential for assessing the reliability of a non-custodial bridge.
Additionally, transparency metrics such as Proof of Reserves are critical. For custodial solutions, the frequency and completeness of on-chain audits determine the trustworthiness of the product. A successful wrapped asset provides real-time, verifiable proof that the underlying BTC exists on the Bitcoin blockchain.
Cross-Chain Velocity
Cross-chain velocity measures how frequently tokenized Bitcoin moves between different ecosystems. High velocity suggests that the asset is liquid and in high demand across various platforms. If wrapped Bitcoin sits stagnant in a single wallet, it is not fulfilling its purpose as a bridge between chains.
This metric also helps identify where the economic center of gravity lies. If large volumes of BTC are moving to a specific Layer 2 or alternative Layer 1 blockchain, it signals a shift in user preference for that environment's features, such as lower fees or faster execution times.
Inscriptions and Block Space Utilization
Ordinal Inscription Volume
Bitcoin Ordinals introduced a novel way to use the blockchain by inscribing data directly onto individual satoshis. Measuring the success of this innovation involves tracking the total number of inscriptions over time. An exponential increase in inscriptions indicates strong demand for on-chain digital artifacts.
Analysts categorize inscriptions by type—text, image, video, or application code. This breakdown reveals how the block space is being utilized. A prevalence of text-based inscriptions might indicate the popularity of token standards like BRC-20, while image-heavy blocks suggest a market for digital collectibles and art.
The impact on the UTXO (Unspent Transaction Output) set is also a technical metric to watch. Since inscriptions are attached to specific UTXOs, a massive proliferation of them can increase the size of the state that nodes must maintain. Monitoring the growth rate of the UTXO set helps developers understand the long-term storage costs imposed by this new utility.
Fee Generation and Miner Revenue
One of the most significant impacts of Ordinals and inscriptions is the generation of transaction fees. In a future where the block subsidy declines, transaction fees must replace the issuance reward to secure the network. The success of protocols like Ordinals is heavily measured by the percentage of miner revenue derived from fees.
During periods of high inscription activity, fees have occasionally exceeded the block subsidy. This is a critical metric for the long-term economic sustainability of Bitcoin security. For a deep dive into this dynamic, see our analysis of Ordinals and their economic impact. If new uses of block space can consistently generate high fees, it alleviates concerns about the diminishing block reward.
However, this must be balanced against the "mempool backlog." While high fees are good for miners, they can price out standard monetary transactions. Analysts measure the congestion levels to determine if the new protocol usage is crowding out the primary use case of peer-to-peer payments.
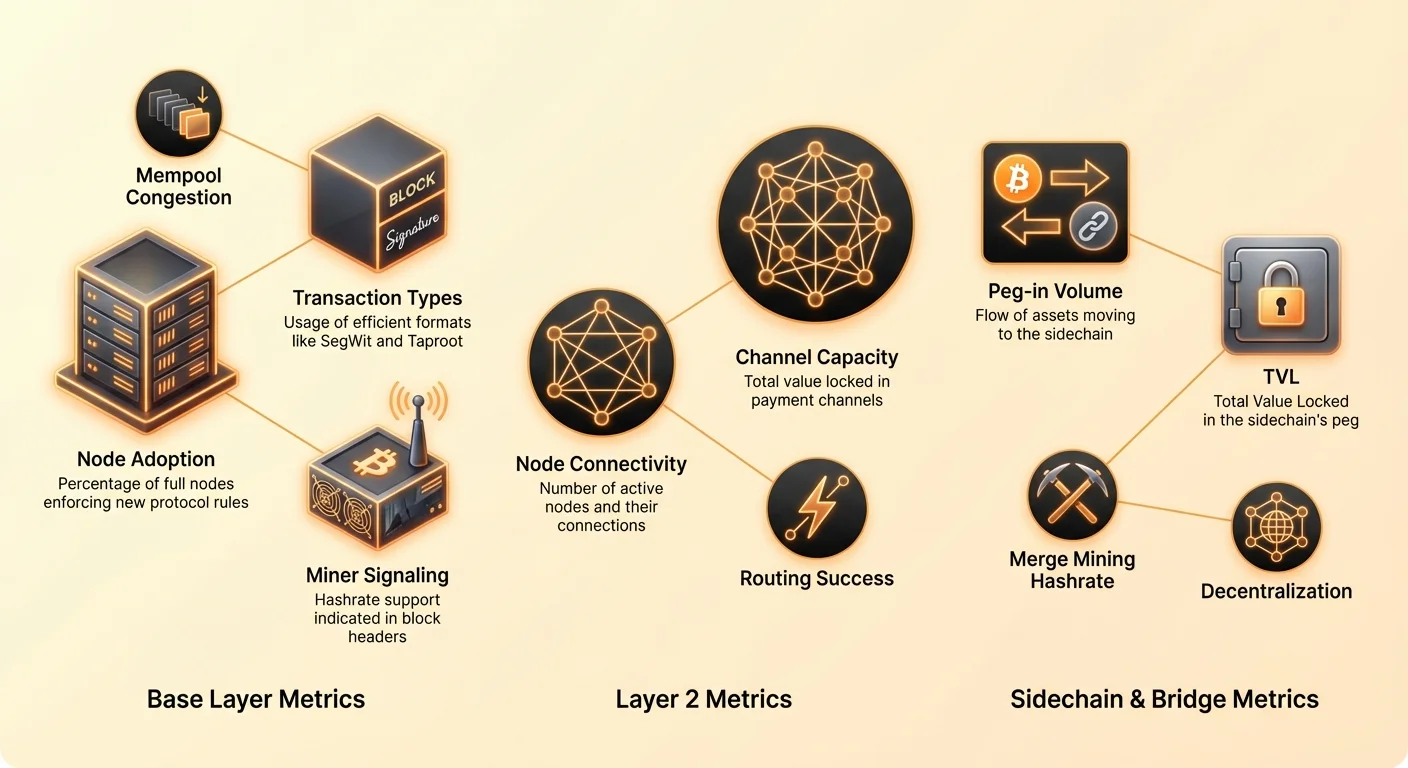
| Metric Category | Primary Indicator | Secondary Indicator |
|---|---|---|
| Base Layer | Node Adoption % | Mempool Congestion |
| Layer 2 | Channel Capacity | Node Connectivity |
| Sidechains | TVL (Peg-in) | Merge Mine Hashrate |
Emerging Proposals and Future Metrics
Fractal Scaling and Recursion
Fractal Bitcoin is a newer concept that proposes a multi-layered approach using recursive blockchains to scale. Measuring the success of such a theoretical or early-stage solution requires new metrics. One such metric is "recursive depth"—the number of layers that can operate efficiently without losing security guarantees.
Another metric is the synchronization speed between the layers. Since fractals operate in parallel, the ability to settle states back to the parent chain quickly is vital. Delays in settlement would undermine the trust in the fractal layers. Therefore, "settlement latency" becomes a primary performance indicator.
Adoption of these complex scaling solutions will likely depend on developer tooling. Success can be measured by the number of software libraries and SDKs (Software Development Kits) available that abstract away the complexity of the fractal structure for end-users.
OP_CAT and Covenants
Proposals like OP_CAT aim to reintroduce specific opcodes to the Bitcoin scripting language to enable covenants and more advanced smart contracts. We detail the case for OP_CAT. The metric for success here begins with community sentiment and technical consensus. Before activation, analysts track the number of technical discussions, code reviews, and testnet implementations.
If activated, the measurement shifts to "covenant utilization." This would track how many transactions utilize the new opcode to create restrictions on where coins can be spent. This is similar to tracking P2TR outputs but specifically focuses on the script logic.
Success would also be defined by the emergence of new wallet features, such as vaults (which allow users to "claw back" stolen funds) that are enabled by these covenants. The number of user funds secured in vault architectures would be the ultimate proof of the upgrade's utility.
Governance Health and Decentralization
Developer Diversity and Activity
Behind every protocol upgrade is a group of developers. A crucial, yet often overlooked, metric of protocol success is the health of the development ecosystem. This is measured by the number of active contributors to the codebase, the frequency of commits, and the diversity of funding sources for those developers.
A protocol that relies on a handful of developers funded by a single entity is fragile. Success is indicated by a growing number of contributors from different backgrounds and companies. This ensures that no single interest group can capture the development process or dictate the roadmap.
Monitoring the "bus factor"—the number of key developers who would need to disappear for the project to stall—is a grim but necessary metric. A high bus factor indicates a resilient and well-documented code base that can survive the loss of individual contributors.
Miner and Pool Decentralization
The decentralization of mining power is the bedrock of Bitcoin's security. While not a software upgrade, the distribution of hashrate is a continuous metric of the protocol's success. Analysts monitor the distribution of blocks found by different mining pools.
If a single pool or a coalition of pools approaches 51% of the hashrate, the censorship resistance of the network is threatened. A successful protocol maintains a wide distribution of power, where no single entity can dictate which transactions are included in a block.
Stratum V2 is a protocol upgrade for mining pools that allows individual miners to construct their own block templates, rather than relying on the pool operator. The adoption rate of Stratum V2 is a key metric for future decentralization, as it shifts power back to the edges of the network.
Conclusion
Moving beyond simple price charts reveals the complex, living organism that is the Bitcoin network. True success for upgrades and Layer 2 solutions is found in the granular data of node adoption, channel liquidity, and transaction types. Whether analyzing the slow-but-steady climb of SegWit adoption or the explosive burst of Ordinal inscriptions, these metrics provide the only accurate map of the ecosystem's evolution. They distinguish between hyped features that fade away and transformative technologies that become the new standard.
As the protocol continues to mature, the metrics used to evaluate it must also evolve. The rise of decentralized bridges, recursive scaling layers, and privacy-preserving upgrades introduces new variables into the equation. Stakeholders must remain vigilant, looking past marketing narratives to verify the on-chain reality. By rigorously tracking capacity, throughput, security thresholds, and decentralization indices, the community ensures that Bitcoin remains a robust foundation for the future of digital value.
Protocol success is not measured by the price of the token, but by the security, utility, and sovereignty of the network.