
Successful trading in the cryptocurrency market requires more than just identifying a good entry point. The difference between a profitable trader and one who struggles often comes down to risk management. Two of the most critical components of this discipline are calculating the correct position size and placing effective stop-loss orders. While many beginners rely on arbitrary numbers or gut feelings, professional strategies utilize market data to make these decisions.
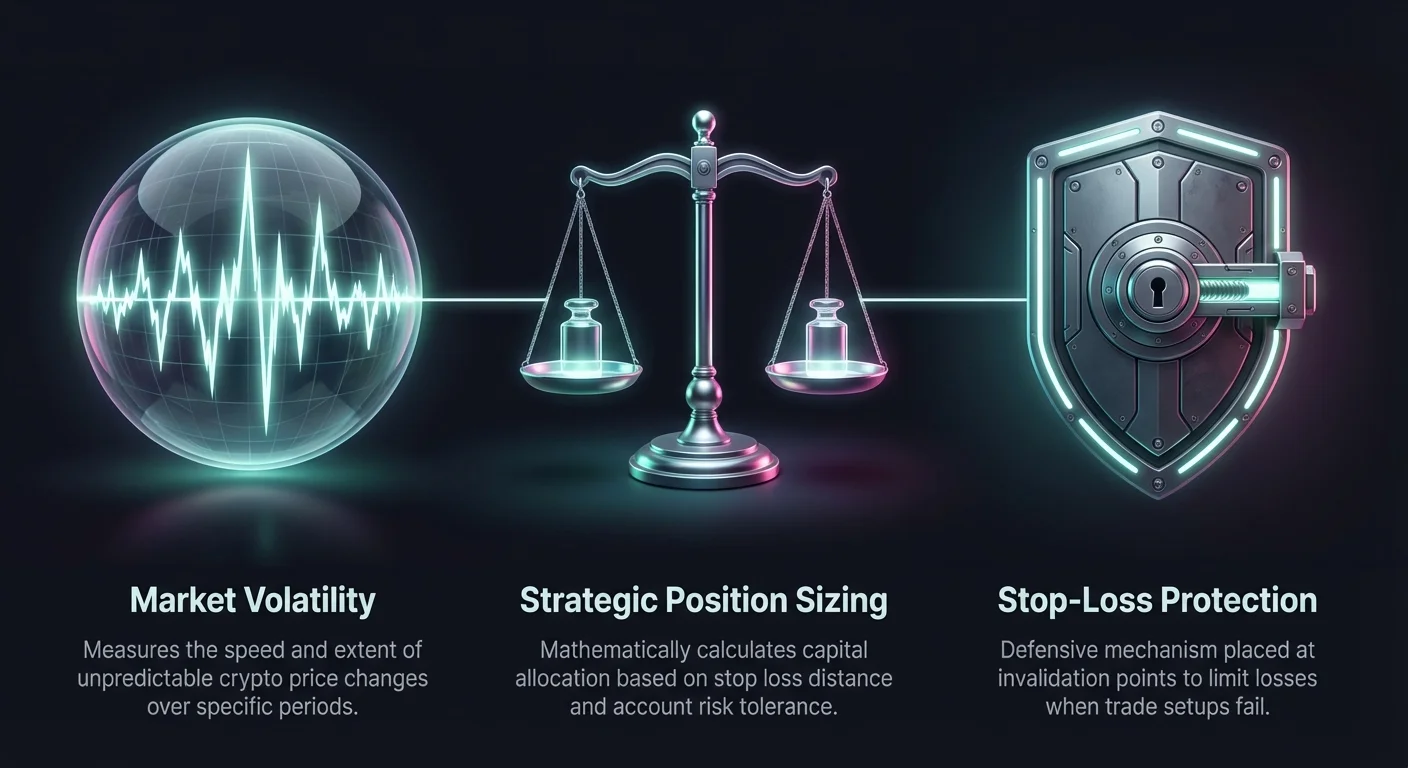
One of the most effective ways to approach this is by analyzing market volatility. Volatility measures the speed and extent of price changes over a specific period. By understanding how much an asset typically moves, traders can adapt their strategies to current market conditions. This approach ensures that stop-loss orders are not triggered by normal market noise and that position sizes are adjusted to reflect the actual risk of the trade.
Navigating the crypto landscape demands a respect for price fluctuations. Assets like Bitcoin and Ethereum can experience significant double-digit percentage moves in a single day. A static strategy that treats every market environment the same is destined to fail. Instead, traders must adopt a dynamic approach that expands and contracts with the market's rhythm. This method protects capital during turbulent times while allowing for growth during stable trends.
The Fundamentals of Market Volatility
Volatility is a statistical measure of the dispersion of returns for a given asset. In simpler terms, it quantifies the range in which the price of a cryptocurrency varies. When an asset is described as volatile, it means the price moves rapidly and unpredictably over short timeframes. This characteristic is inherent to the crypto market due to its relative maturity, liquidity constraints, and speculative nature.
High volatility presents a unique set of challenges and opportunities. On one hand, the potential for rapid price appreciation attracts investors looking for substantial returns. On the other hand, the risk of sharp declines is equally prevalent. Understanding this duality is essential for placing stop-losses. If a market is highly volatile, a tight stop-loss is likely to be hit prematurely by random fluctuations, forcing the trader out of a position that might have eventually been profitable. Understanding how to manage these rapid swings often requires utilizing volatility hedging strategies.
Conversely, low volatility environments are characterized by steady, gradual price movements. In these scenarios, price fluctuations are less erratic, allowing for tighter stop-loss placement. Traders can take larger positions because the immediate risk of a massive swing is reduced. Recognizing the current volatility state is the first step in calculating appropriate trade parameters.
Several factors contribute to these price swings. Economic events, regulatory news, and technological updates can all trigger immediate reactions. Furthermore, liquidity plays a massive role. In markets with lower trading volumes, a single large order can move the price significantly, creating artificial volatility. By monitoring these factors, traders can anticipate changes in market behavior and adjust their risk management parameters accordingly.

The Mechanics of Position Sizing
Position sizing is the process of determining how much capital to allocate to a specific trade. This decision should never be based on how confident a trader feels or how much money they want to make. Instead, it must be a mathematical calculation based on the distance to the invalidation point, or stop-loss, and the total account risk tolerance.
The primary goal of position sizing is to ensure that a losing trade does not significantly damage the overall portfolio. A common rule of thumb is to risk only a small percentage of the total account balance on any single trade. However, the actual dollar amount invested will vary depending on the volatility of the asset.
If a trader determines that a wide stop-loss is necessary due to high volatility, the position size must be reduced to maintain the same dollar risk. For example, if the stop-loss is 10% away from the entry price, the position size must be smaller than if the stop-loss were only 2% away. This inverse relationship between stop width and position size is the cornerstone of volatility-based risk management, a principle central to the Science of Leverage.
Failing to adjust position size based on the stop-loss distance is a critical error. If a trader uses a fixed position size regardless of the stop placement, they are taking on variable risk. A trade with a wide stop becomes significantly riskier than a trade with a tight stop. Consistency in risk taking, not consistency in lot size, is what leads to long-term stability.
Stop-Loss Placement Strategy
A stop-loss order is a defensive mechanism designed to limit an investor's loss on a security position. It instructs the exchange to sell the asset once it reaches a certain price. The placement of this order is crucial. It must be placed at a level where the trade setup is proven wrong, also known as the invalidation point.
Placing stops too close to the entry price often results in "whipsawing," where the price dips just enough to trigger the stop before reversing in the intended direction. This is frequently caused by normal market volatility rather than a genuine trend reversal. To avoid this, the stop-loss should be placed outside the range of typical market noise.
Technical analysis provides several tools to identify logical stop-loss levels. Support and resistance zones are primary candidates. A stop-loss for a long position is often placed just below a verified support level. The logic is that if the price breaks this floor, the bullish thesis is invalid. Similarly, for short positions, stops are placed above resistance levels.
However, support and resistance levels are obvious to all market participants. Sometimes, market makers or large traders may push prices slightly beyond these levels to trigger stops before reversing the trend. This is where combining technical levels with volatility metrics becomes powerful. By adding a buffer based on the asset's average range of movement, traders can protect their stops from these "stop hunts."
Utilizing Candlestick Patterns for Precision
Candlestick charts offer immediate visual data regarding price action, providing cues for precise stop-loss placement. Each candlestick represents a specific timeframe and displays the open, close, high, and low prices. The "wicks" or shadows of the candles are particularly important for risk management as they show the extremes of price movement during that period.
Key patterns such as the Hammer or the Shooting Star indicate potential reversals. A Hammer, which appears at the bottom of a downtrend, features a long lower wick. This wick represents a rejection of lower prices. When entering a long trade based on this pattern, a logical stop-loss placement is just below the lowest point of the wick. This level represents the ultimate line in the sand for buyers, especially after decoding the signals from candle wicks.
Similarly, an Engulfing pattern signals a strong shift in momentum. A Bullish Engulfing candle fully consumes the previous red candle, suggesting buyers have taken control. Placing a stop below the low of the engulfing candle structure provides a clear invalidation point. If the price were to drop back below this level, it would indicate that the buying momentum was a false signal.
Traders should also pay attention to the "body" of the candle compared to the wicks. Small bodies with long wicks signal indecision and high volatility. In these cases, price is fluctuating wildly but closing near the open. This suggests that stops should be placed wider to account for the intraday or intra-period volatility that is occurring.
Incorporating Technical Indicators
Technical indicators can serve as objective rulers to measure market conditions, helping to refine both stop placement and entry timing. While candlesticks show immediate price action, indicators like Moving Averages (MA) provide a smoothed view of the trend over time. These averages can act as dynamic support and resistance levels.
The 50-day and 200-day moving averages are widely watched by institutional and retail traders. In a strong uptrend, the price often respects the 50-day MA. Placing a stop-loss slightly below this moving average allows the trade to breathe while maintaining a trailing protection level. As the trend progresses, the moving average rises, effectively trailing the stop and locking in potential profits.
Momentum indicators like the Relative Strength Index (RSI) help identify when a market is overextended. An RSI above 70 typically indicates overbought conditions, while below 30 suggests oversold. If entering a long position when the RSI is already high, the risk of a pullback is elevated. Utilizing a confirmation stack that includes indicators like RSI, MACD, and Stochastic ensures reliable entries. In this scenario, a trader might reduce their position size to account for the increased probability of near-term volatility or a correction.
The Moving Average Convergence Divergence (MACD) offers signals regarding trend strength. A "Golden Cross" in the MACD or moving averages signals building bullish momentum. This confirmation can give traders the confidence to widen stops slightly to capture a larger trend, knowing that the underlying momentum supports the position. Conversely, bearish divergence on the MACD might suggest tightening stops to protect capital as momentum wanes.
The Role of Volume in Confirmation
Trading volume is a vital confirmation tool that verifies the validity of a price move. It represents the total amount of an asset traded within a specific timeframe. Analyzing volume alongside price action helps traders distinguish between weak fluctuations and strong, sustainable trends.
High volume during a price breakout suggests strong conviction from market participants. If Bitcoin breaks a resistance level on high volume, it indicates that significant capital is backing the move. In this context, support levels are more likely to hold, allowing for standard stop-loss placement.
Conversely, a breakout on low volume is often a trap. It suggests a lack of genuine interest, and the price is liable to reverse quickly. When trading a low-volume move, risk is higher. Traders should consider reducing their position size or tightening their stop-loss to exit quickly if the move fails.
Liquidity, which is closely related to volume, also impacts risk management. In low-liquidity environments, the gap between the buying and selling price (the spread) can widen. This can lead to slippage, where a stop-loss is executed at a worse price than intended. To mitigate this, traders trading illiquid assets must reduce their position size to ensure they can exit without crashing the price, a key topic in Liquidity and Slippage Mastery.
Identifying Trend Reversals
Recognizing the end of a trend is just as important as identifying the beginning. Major moving average crossovers, such as the Golden Cross and the Death Cross, serve as significant markers for long-term trend shifts. These signals help traders adjust their bias and risk parameters for longer holding periods.
A Death Cross occurs when a short-term moving average crosses below a long-term average, signaling a potential long-term bear market. For a trader holding a long position, this is a critical warning sign. It suggests that the dominant momentum has shifted to the downside. Upon seeing this, a prudent strategy would be to tighten stops or close positions entirely to preserve capital.
On the flip side, a Golden Cross indicates the start of a bullish phase. When this occurs, volatility often increases as new buyers rush into the market. Traders entering at this stage might choose to use wider stops to avoid being shaken out during the initial volatility of the new trend. They can size their positions smaller to accommodate this wider risk range.
It is important to note that these crossovers are lagging indicators. They confirm a move that has already started. Therefore, they should be used in conjunction with other tools like RSI or support levels to refine the exact placement of the stop-loss order. Relying solely on the cross may result in entries and exits that are too far from the optimal price.
Mental Discipline and Risk Psychology
Even with the perfect mathematical formula for position sizing and stop placement, trading success ultimately relies on discipline. The psychological aspect of trading is often the hardest hurdle to overcome. Fear and greed can cause traders to abandon their plans, move stop-losses, or oversize positions in hopes of a quick recovery.
Sticking to the calculated position size is a defense against emotional trading. When a trader knows exactly how much they will lose if the stop is hit, the fear of loss is diminished. The loss becomes a known business expense rather than a catastrophic event. This clarity allows the trader to remain rational and focused on the market data.
One common psychological trap is moving a stop-loss further away as the price approaches it. This is often driven by the hope that the price will reverse. However, this defeats the purpose of the stop-loss and exposes the account to unlimited risk. Emotional discipline dictates that once a plan is set, it must be honored.
Another error is "revenge trading" after a loss. Traders may feel the urge to increase their position size on the next trade to make back what was lost. This behavior ignores market conditions and volatility, leading to reckless exposure, common among those falling for behavioral finance traps. Adhering to a strict sizing model based on volatility ensures that every trade is treated independently and objectively.
Structuring the Trade: A Step-by-Step Approach
To bring all these elements together, traders can follow a structured process for every trade setup. This consistency ensures that no critical factor is overlooked and that risk is always aligned with market conditions.
Step 1: Identify the Invalidion Point
Before considering position size or profit targets, look at the chart. Find the support level, candlestick wick, or moving average that, if broken, proves the trade idea wrong. This is your static stop-loss price.
Step 2: Assess Volatility
Look at the recent price action. Are the candles large and erratic, or small and uniform? Is the asset in a period of high or low volatility? If volatility is high, consider adding a buffer to your stop-loss price to account for noise.
Step 3: Calculate Risk Distance
Measure the percentage distance between your entry price and your determined stop-loss price. For example, if entering at $100 and the stop is at $95, the risk distance is 5%.
Step 4: Determine Position Size
Decide the dollar amount of your account you are willing to lose (e.g., 1% of total capital). Use the risk distance to calculate how much of the asset you can buy. If the stop is wide, buy less. If the stop is tight, buy more.
| Volatility State | Price Action | Stop-Loss Strategy | Position Sizing Impact |
|---|---|---|---|
| High | Large candles, erratic swings | Wide stops, buffered placement | Reduced size to limit risk |
| Moderate | Steady trend, clear levels | Standard stops at technical levels | Standard size |
| Low | Small candles, tight range | Tight stops, close to support | Increased size possible |
Using On-Chain Signals for Macro Awareness
While technical analysis focuses on price charts, on-chain signals can provide a broader context for Bitcoin and crypto assets. Indicators like the Pi Cycle Top use moving averages to identify when the market is becoming overheated on a macro scale.
The Pi Cycle Top indicator historically identifies cycle peaks within days. If this indicator flashes a signal, it suggests that the entire market may be due for a major reversal. For a trader, this is a signal to be extremely defensive. Stop-losses should be tightened significantly to lock in gains.
Conversely, understanding these macro cycles helps in avoiding bad entries. Entering a massive long position with a wide stop just as a cycle top signal appears would be poor risk management. These indicators serve as a traffic light for the overall aggressiveness of the trading strategy.
By combining macro signals with daily volatility reading, traders get a complete picture. They know when to push for larger gains and when to protect capital. This holistic view prevents getting caught on the wrong side of a major market shift.
Conclusion
Mastering position size and stop-loss placement is the definitive skill that separates professional traders from gamblers. It requires a shift in mindset from focusing solely on profits to prioritizing capital preservation. By utilizing volatility as the primary gauge for risk, traders can adapt to the ever-changing crypto landscape.
The integration of technical tools like candlesticks, moving averages, and momentum indicators provides the necessary data to make informed decisions. These tools transform abstract concepts of risk into concrete price levels and position numbers. A disciplined approach, grounded in mathematical logic rather than emotion, ensures longevity in the market.
True risk management means adjusting your position size so that a stop-loss hit is just a calculated expense, not a financial disaster.