
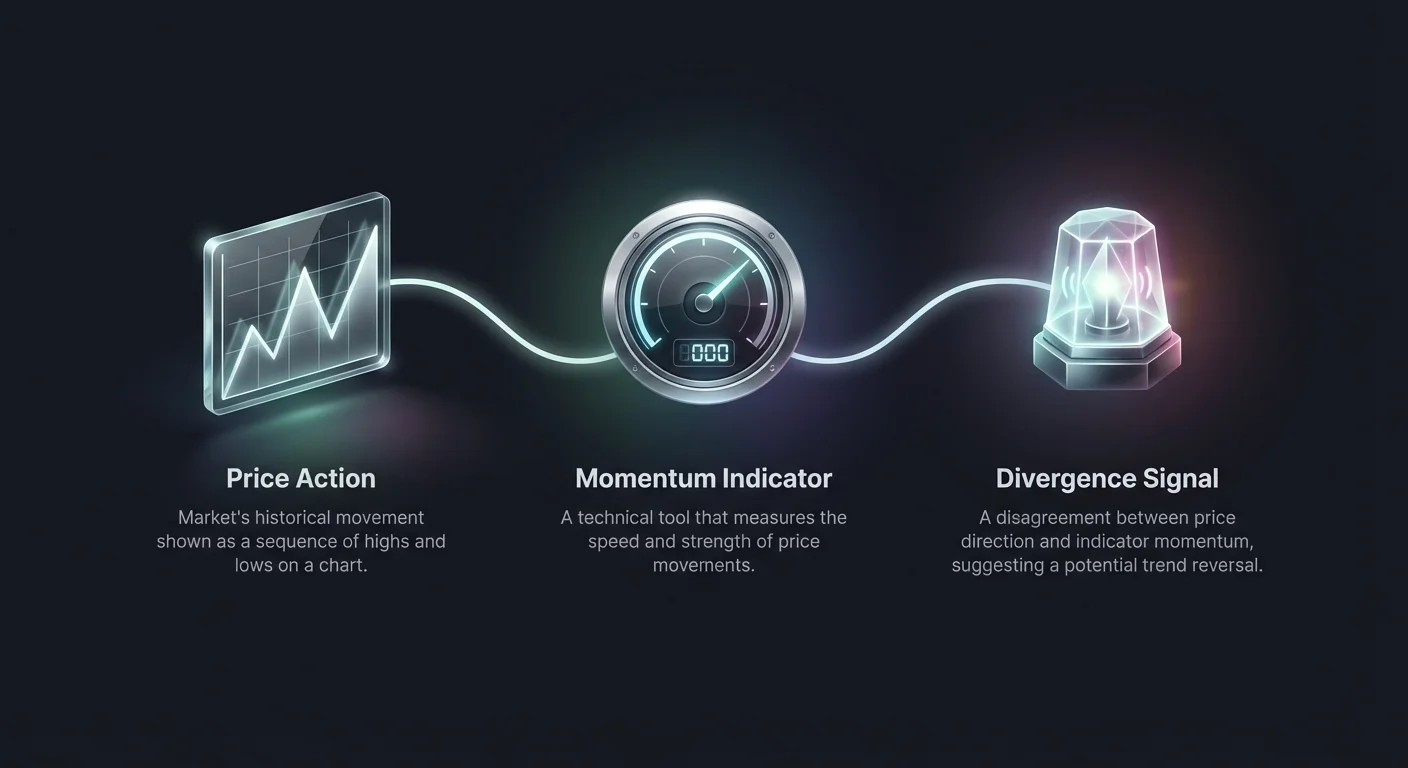
Successful trading often requires looking beyond the immediate price action to understand the underlying strength or weakness of a market trend. While price charts show the history of value, they do not always reveal the momentum driving those movements. This is where the concept of divergence becomes a critical tool for technical analysts. Divergence occurs when the price of an asset moves in the opposite direction of a technical indicator, usually an oscillator like the Relative Strength Index (RSI) or the Moving Average Convergence Divergence (MACD). This disagreement between price and momentum often signals that the current trend is losing power and a reversal may be imminent.
Identifying these hidden signals allows traders to anticipate potential market shifts before they become obvious on the price chart. Rather than chasing a rally that is about to peak or panic-selling near a bottom, divergence trading helps identify high-probability entry and exit points. It provides a glimpse into the internal mechanics of the market, revealing when buyer exhaustion or seller fatigue is setting in. By combining divergence analysis with other technical tools, traders can build a more robust strategy for navigating the volatile cryptocurrency landscape.
The Mechanics of Market Momentum
To understand divergence, one must first grasp the role of momentum indicators. These tools are designed to measure the speed and change of price movements. In a healthy trend, momentum and price should move in harmony. If Bitcoin is making new highs, the momentum indicator should also be reaching new highs, confirming that buyers are stepping in with increasing strength. Similarly, in a strong downtrend, lower prices should be accompanied by lower momentum readings, indicating continued selling pressure.
However, markets are rarely perfectly efficient. There are periods where price continues to drift upward due to inertia or late retail buying, even though the "smart money" has stopped pushing the asset aggressively. This creates a disconnect. The price might inch higher, but the indicator fails to confirm the move, creating a divergence. This is a warning sign that the trend's energy is depleting. It suggests that the market is running on fumes and that a correction or a full trend reversal could be on the horizon.
Understanding the Relative Strength Index (RSI)
The Relative Strength Index (RSI) is perhaps the most popular tool for spotting these discrepancies. Developed to gauge the speed and change of price movements, the RSI oscillates between zero and 100. It is primarily used to identify overbought conditions, typically when the reading is above 70, and oversold conditions, when the reading drops below 30. These extremes often precede market pullbacks or bounces, but they are not standalone buy or sell signals.
In strong trending markets, an asset can remain overbought or oversold for extended periods. This is why divergence is a more powerful signal than simple overbought/oversold readings. When the RSI begins to disagree with the price action, it adds a layer of nuance to the analysis. It indicates that while the price is still pushing into extreme territory, the conviction behind that push is fading.
| Feature | Bullish Scenario | Bearish Scenario |
|---|---|---|
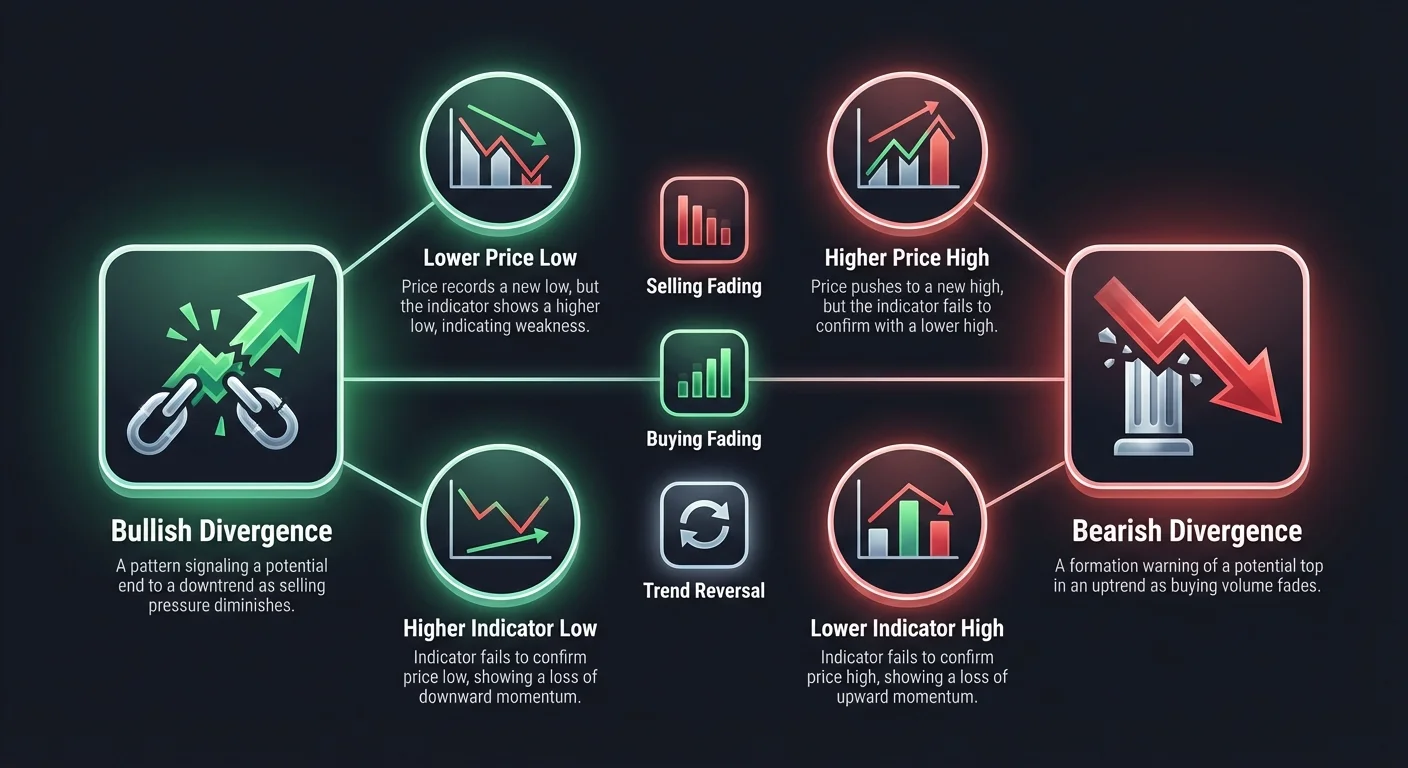
| Price Action | Makes Lower Lows | Makes Higher Highs |
| RSI Action | Makes Higher Lows | Makes Lower Highs |
| Implication | Selling pressure fading | Buying pressure fading |
Decoding Bullish Divergence
A bullish divergence is a technical pattern that signals a potential end to a downtrend. It occurs when the price of an asset records a lower low, but the momentum indicator creates a higher low. Visually, the price chart shows a downward slope, while the indicator chart shows an upward slope. This contradiction is significant because it suggests that while sellers are still managing to push the price down, their strength is diminishing.
Psychologically, this pattern represents a shift in market sentiment. The final push to a new price low is often driven by panic selling or capitulation from weak hands. However, the higher low on the indicator reveals that the intensity of the selling has decreased compared to the previous drop. This loss of downward momentum indicates that bears are losing control and bulls may be quietly accumulating positions.
Traders often look for bullish divergence near known support levels to increase the probability of a successful trade. If the divergence aligns with a major support zone or a key Fibonacci level, the signal is considered more reliable. It is essentially the market whispering that the bottom is near, providing an opportunity to enter a long position with a relatively tight stop-loss below the recent price low.
Analyzing Bearish Divergence
Conversely, bearish divergence is a pattern that warns of a potential top in an uptrend. This formation happens when the price of an asset makes a higher high, but the momentum indicator makes a lower high. The price chart slopes upward, while the indicator slopes downward. This signal suggests that the asset is rising on weakening momentum, often referred to as an "exhaustion move."
In this scenario, the price is pushing into new territory, perhaps driven by FOMO (Fear Of Missing Out) or late-stage speculation. However, the failure of the indicator to make a new high reveals that buying volume or speed is dropping off. The underlying strength that fueled the earlier stages of the rally is no longer present. This is a classic sign that the smart money is distributing their holdings to latecomers, preparing for a market correction.
Bearish divergence is particularly potent when it occurs after an extended rally or near significant resistance levels. Traders viewing this signal might choose to tighten their stop-loss orders to protect profits or consider entering a short position. It serves as an early warning system, allowing traders to exit before the crowd realizes the trend has turned.
The Role of the MACD in Divergence
The Moving Average Convergence Divergence (MACD) indicator offers another perspective on divergence trading. Unlike the RSI, which is a single line, the MACD uses moving averages to determine trend direction and strength. The MACD consists of the MACD line, the signal line, and a histogram. Divergences can appear on the MACD lines themselves or, more commonly, on the histogram which measures the distance between the two lines.
A bullish divergence on the MACD histogram occurs when price makes a lower low, but the histogram bars form a higher low (closer to the zero line). This indicates that the downward momentum is decelerating even if price is still dropping. It is a sign that the bearish trend is losing its velocity. Traders watch for the histogram to eventually cross above the zero line as confirmation that momentum has officially shifted to the upside.
Bearish divergence on the MACD is identified when price hits a higher high, but the histogram peaks at a lower level than the previous rally. This shrinking histogram suggests that the upward momentum is contracting. When combined with a crossover where the MACD line drops below the signal line, it provides a strong technical case for a potential price reversal. The MACD is a lagging indicator, so these signals often confirm what oscillators like RSI are already suggesting.
Integrating the Stochastic Oscillator
The Stochastic Oscillator is another valuable tool for identifying divergence, particularly in range-bound markets. This indicator compares a specific closing price of an asset to a range of its prices over a certain period. Like the RSI, it moves between zero and 100. The Stochastic Oscillator is composed of two lines: the %K line and the %D signal line. It is known for its sensitivity and ability to provide leading signals.
When using the Stochastic Oscillator, traders look for the same patterns of higher highs in price versus lower highs in the indicator (bearish), or lower lows in price versus higher lows in the indicator (bullish). Because the Stochastic is more volatile than the RSI, it can generate more signals, some of which may be false. Therefore, it is crucial to wait for the crossover of the %K and %D lines to confirm the divergence.
A bullish signal is strengthened if the divergence occurs when the Stochastic is in the oversold territory (below 20). Conversely, a bearish divergence carries more weight if it forms while the indicator is in the overbought zone (above 80). By focusing on divergences that occur at these extremes, traders can filter out noise and focus on high-probability reversal setups.
Confirmation via Trading Volume
While divergence provides a strong hint of a reversal, it is not a guarantee. To avoid false signals, traders should seek confirmation from trading volume. Volume represents the total amount of an asset traded during a specific period and acts as a lie detector for price moves. In a genuine trend, volume should increase in the direction of the trend.
In the context of bullish divergence, traders should look for a decline in selling volume as the price makes its final low. This confirms that the selling pressure is drying up. When the price eventually reverses and starts to move up, valid confirmation would be a spike in buying volume. This influx of volume validates that new buyers are entering the market aggressively, supporting the reversal signal generated by the divergence.
For bearish divergence, the ideal scenario involves price making a new high on declining volume. This indicates a lack of participation in the new high, suggesting that the price increase is not supported by strong demand. If high volume subsequently enters on a down candle, it confirms that sellers have taken control. Volume analysis transforms a speculative divergence signal into a confirmed trade setup.
Candlestick Patterns as Triggers
Candlestick charts are essential for timing entries based on divergence signals. Once a divergence is spotted, traders should not enter immediately but rather wait for a specific candlestick pattern to trigger the trade. Candlesticks provide immediate visual data on the battle between buyers and sellers within a specific timeframe.
For a bullish divergence setup, traders should look for reversal patterns such as a Hammer or a Bullish Engulfing candle. A Hammer features a small body with a long lower wick, indicating that sellers pushed the price down, but buyers pushed it back up to close near the open. If this appears at the low of a bullish divergence, it is a powerful entry signal.
Conversely, when dealing with bearish divergence, patterns like the Shooting Star or Bearish Engulfing are key. A Shooting Star has a long upper wick, showing that buyers tried to push price higher but failed, with sellers forcing the close lower. Finding a Shooting Star pattern at the peak of a bearish divergence provides a precise entry point for a short trade or a signal to close long positions.
Timeframes and Reliability
The reliability of divergence signals is heavily dependent on the timeframe being analyzed. In general, signals on longer timeframes, such as the daily or weekly charts, carry more weight than those on shorter timeframes like the 15-minute or 1-hour charts. A divergence on a weekly chart can signal a trend change that lasts for months, whereas a divergence on a 5-minute chart might only result in a minor, short-lived correction.
Traders often use a multi-timeframe approach to increase their success rate. For example, a trader might identify a major bullish divergence on the daily chart to determine the overall bias. They might then zoom into a 4-hour or 1-hour chart to find a precise entry point using a smaller divergence or a candlestick pattern. This aligns the short-term entry with the long-term structural potential.
However, one must be aware that on shorter timeframes, cryptocurrencies can be prone to "noise" and false signals. High volatility can cause indicators to fluctuate rapidly, creating divergences that resolve quickly without a significant price reversal. Therefore, beginners are often advised to stick to the 4-hour charts and above when learning to trade divergence to avoid being whipsawed by market noise.
The Golden and Death Cross Context
While divergence signals short-to-medium term reversals, placing them in the context of major trend indicators like the Golden Cross or Death Cross can improve decision-making. A Golden Cross occurs when a short-term moving average (usually the 50-day) crosses above a long-term average (the 200-day). This is a major bullish signal indicating long-term upward momentum.
If a trader spots a bullish divergence while the market is also in a Golden Cross formation, the probability of a successful trade increases significantly. The divergence indicates the end of a pullback, while the Golden Cross confirms the broader uptrend remains intact. This confluence of signals suggests buying the dip in a strong market.
Conversely, a Death Cross (50-day crossing below 200-day) signals a long-term bear market. If a bearish divergence appears while a Death Cross is active, it suggests that a counter-trend rally is failing and the primary downtrend is resuming. Using these major moving average crossovers as a filter helps traders align their divergence trades with the dominant market flow.
Risk Management in Divergence Trading
No technical signal is 100% accurate, and divergence is no exception. In strong trending markets, a "fake out" can occur where a divergence forms, but the price continues to trend in the original direction after a brief pause. This typically happens during parabolic moves where momentum is so strong that oscillators remain in extreme territories for extended periods despite minor fluctuations.
This reality makes risk management non-negotiable. Stop-loss orders are essential tools to protect capital. When trading a bullish divergence, a logical place for a stop-loss is just below the most recent swing low. If the price breaks this level, the divergence setup is invalidated, and the downtrend is likely continuing.
Position sizing is another critical aspect of risk control. Traders should never risk more capital than they can afford to lose on a single trade. By allocating only a small percentage of a portfolio to any individual setup, a trader can survive a string of failed divergence signals without suffering catastrophic losses. Emotional discipline—sticking to the plan even when the market looks chaotic—is the final line of defense in risk management.
Combining Fundamental and Sentimental Analysis
While divergence is a technical concept, it does not exist in a vacuum. Smart traders verify technical signals against fundamental and sentimental analysis. Fundamental analysis involves evaluating the intrinsic value of the asset, looking at network adoption, technological upgrades, or macroeconomic factors. If a bullish divergence appears on Bitcoin, but global economic news is overwhelmingly negative, the technical signal might fail.
Sentimental analysis gauges the mood of the market. Tools like the Fear & Greed Index or social media volume can provide context to technical patterns. For instance, bullish divergence is often most effective when market sentiment is in extreme fear. This aligns with the technical view that sellers are exhausted and the market is oversold.
Conversely, bearish divergence is most reliable when the market is in a state of extreme greed or euphoria. When everyone is celebrating new highs and social media is buzzing with "moon" predictions, but the RSI is showing a divergence, it is a strong indicator that the top is near. Integrating these three pillars—technical, fundamental, and sentimental—provides a holistic view that charts alone cannot offer.
Market Cycles and the Bigger Picture
Understanding where an asset sits within its broader market cycle can also enhance the effectiveness of divergence trading. Indicators like the Pi Cycle Top use moving averages to identify macro peaks in Bitcoin's cycle. If a Pi Cycle Top signal is flashing, and a bearish divergence appears on the weekly chart, the warning is severe.
These cycle indicators help traders distinguish between a routine correction and a cycle-ending crash. A bearish divergence during the middle of a bull run might just signal a 20% pullback before the trend resumes. However, the same divergence occurring near historical cycle peaks could signal the onset of a multi-year bear market.
Recognizing these distinctions allows investors to adjust their strategies. In a mid-cycle correction, they might take partial profits or wait to buy lower. At a cycle peak, they might exit positions entirely. The convergence of cycle analysis with divergence signals offers a strategic advantage for long-term portfolio management.
Chart Patterns and Liquidity
Chart patterns such as triangles, flags, and head-and-shoulders formations often develop alongside divergence. A head-and-shoulders pattern is a classic reversal formation. If the "right shoulder" of the pattern forms with a bearish divergence on the RSI, it serves as a double confirmation of the reversal.
Liquidity also plays a role in how these patterns play out. High liquidity zones, where there is a significant volume of limit orders, often act as magnets for price. If a bullish divergence suggests a reversal, traders should look for liquidity pools above the current price as potential targets.
Conversely, low liquidity environments can lead to increased volatility and slippage. In such conditions, divergence signals may be less reliable as small trades can cause outsized price movements. Understanding the liquidity profile of the asset being traded helps in setting realistic expectations for price behavior following a signal.
Avoiding Common Pitfalls
One common mistake beginners make is acting on divergence too early. As mentioned, oscillators can stay overbought or oversold for a long time. A divergence can essentially "reset" if the price action becomes strong enough. This is why waiting for a confirmation candle or a break of market structure (like a lower low after a bearish divergence) is crucial.
Another pitfall is ignoring the trend. Trading against the trend (counter-trend trading) is inherently riskier than trading with it. A bearish divergence in a massive bull run might only result in a sideways consolidation rather than a price drop. Beginners are often safer using divergence to enter in the direction of the larger trend—for example, finding a bullish divergence during a pullback in an overall uptrend.
Finally, reliance on a single indicator is dangerous. If the RSI shows divergence but the MACD and Stochastic do not, the signal is weak. Confluence, where multiple indicators tell the same story, significantly increases the success rate of a trade setup.
Conclusion
Divergence trading is a powerful methodology that allows traders to peek under the hood of the market and gauge the true strength of price movements. By identifying discrepancies between price action and momentum indicators like RSI, MACD, and the Stochastic Oscillator, traders can anticipate reversals and spot exhaustion points that are invisible to those looking at price alone. However, like all trading strategies, it requires patience, confirmation, and context.
Successful application of this strategy involves more than just spotting lines on a chart. It requires integrating these signals with candlestick patterns, volume analysis, and broader market context indicators like moving averages and sentiment. By combining these tools with strict risk management practices, traders can navigate the complexities of the crypto market with greater confidence and precision.
Always wait for confirmation from volume or candlestick patterns before acting on a divergence signal.