
デジタル経済を探求する際、多くの新規参入者は価格変動と市場のハイプだけに焦点を当てます。しかし、暗号資産の真の持続可能性と長期的な可能性は、その基本設計——tokenomicsと呼ばれる経済構造——によって決定されます。
トークノミクス(「token」と「economics」の造語)は、デジタル資産を統治する特性と規則を指します。トークンがどのように作成、分配、使用され、その価値が時間とともに維持または増加されるよう意図されているかを定義します。トークンが分散型ネットワークの燃料であるなら、トークノミクスはそのエンジン設計の設計図です。
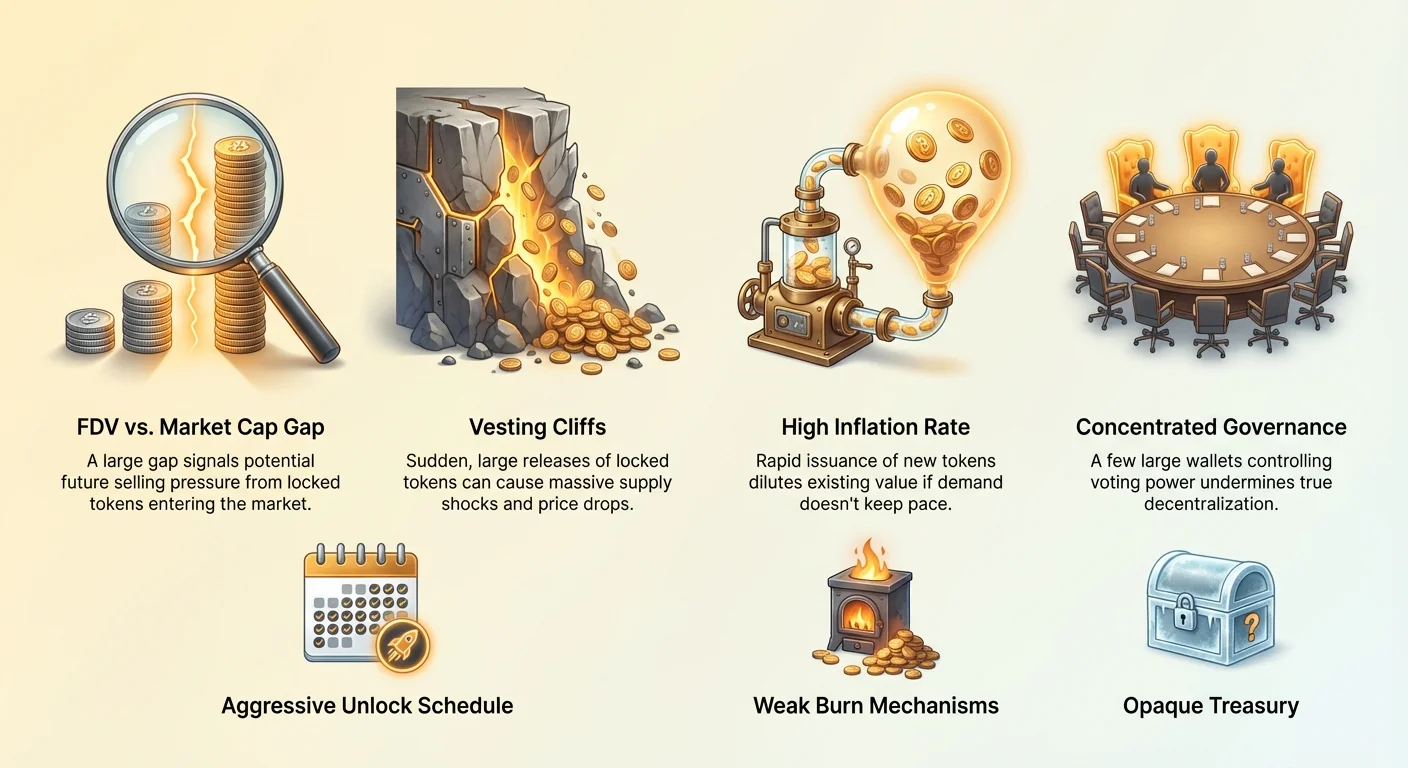
自己主権的な投資家にとって、トークノミクスをマスターすることは不可欠です。それは表面的な指標を見抜き、供給ショック、過度に中央集権的なコントロール、持続不可能なインフレ率などの潜在的な警告サインを発見することを可能にします。このガイドは、経験豊富なベテランのようにあらゆる暗号資産を評価するために必要な厳密な分析フレームワークを提供し、投資決定が単なる投機ではなく構造的な現実に根ざしたものになることを保証します。
Decoding Supply: Circulating vs. Fully Diluted Valuation
The first step in any tokenomics analysis is understanding the asset’s supply structure. Unlike traditional stock markets, where the total number of shares is usually fixed and known, crypto assets often have dynamic supplies influenced by mining, burning, and scheduled releases.
Understanding Total Supply and Circulating Supply
Every token project defines a Total Supply, which is the maximum number of tokens that will ever exist (if it has a hard cap, like Bitcoin’s 21 million), or the current maximum set by the protocol.
The Circulating Supply is the number of tokens currently available to the public and actively trading on the market.
Why the distinction matters: If a project has a Total Supply of 1 billion tokens, but only 100 million are currently circulating (10%), that means 900 million tokens are yet to enter the market. If these 900 million tokens are released too quickly, they represent a massive potential selling pressure that can dramatically depress the price.
The Critical Metric: Fully Diluted Valuation (FDV)
To account for future supply releases, analysts use the Fully Diluted Valuation (FDV). FDV answers the question: What would the market capitalization be if every single token that will ever exist was released and trading today?
The calculation is straightforward:
FDV in Practice:
Imagine Project Alpha has:
- Circulating Supply: 100 million tokens
- Current Price: $1.00
- Market Cap: $100 million
Imagine Project Beta has:
- Total Supply: 1 billion tokens (900 million are locked)
- Current Price: $1.00
- FDV: 1,000,000,000 tokens $1.00 = $1 billion
While both projects have the same market capitalization today ($100 million), Project Beta's FDV is ten times higher. This means that future growth for Beta must absorb the future sale of 900 million tokens before the existing holders see significant proportional price appreciation.
Actionable Tip: Always compare the Market Cap to the FDV. If a project's FDV is significantly higher (5x to 10x) than its Market Cap, it signals substantial inflation risk down the line due to future unlock events. High FDV relative to current Market Cap is a major tokenomics red flag unless the unlock schedule is very aggressive and the utility model is proven.
The Hidden Risks: Analyzing Vesting and Unlock Schedules
The most critical factor influencing short-to-medium-term price stability is the vesting schedule. This schedule determines when founders, early investors (Venture Capital/VCs), and development teams are allowed to sell the tokens they received at low, private-sale prices.
What is Vesting and Why Does it Exist?
Vesting is a fundamental mechanism borrowed from the traditional tech world. It ensures that those who received tokens early (often at a massive discount) are incentivized to stay with the project for the long haul. They receive their tokens not all at once, but over an extended period.
Vesting schedules typically contain two components:
- The Cliff: This is a waiting period, often 6 or 12 months, where no tokens are released. If the team leaves or fails to deliver before the cliff, they receive nothing.
- The Linear Release: Once the cliff is passed, the locked tokens begin to release to the holders daily, weekly, or monthly over the remainder of the vesting period (often 2 to 4 years).
Analyzing the Vesting Distribution:
When reviewing a whitepaper or tokenomics document, focus on the percentage of the supply allocated to these groups:
| Allocation Group | Typical Vesting Schedule | Risk Profile |
|---|---|---|
| Founders/Team | 3-4 years, 1-year cliff | Necessary alignment, but potential for large dump post-vesting. |
| Private Investors/VCs | 1-3 years, 6-12 month cliff | Most dangerous. They bought cheap and may sell aggressively at the first major pump. |
| Treasury/Ecosystem | Non-vested, controlled by governance. | Potential for centralization if distribution is poorly managed. |
| Community/Airdrops | Often fully unlocked (no vesting). | Minimal risk, as tokens are widely dispersed. |
Identifying "Supply Shocks"
A supply shock occurs when a massive, coordinated release of tokens hits the market at the same time, often overwhelming buying demand and causing the price to drop significantly.
To analyze this risk, you must map the unlock schedule:
- Find the Schedule: Locate the official schedule (usually a chart or timeline in the project’s documentation).
- Identify Key Dates: Mark the dates where the "Cliff" periods for large groups (VCs or the Team) expire.
- Calculate the Percentage: Determine what percentage of the current circulating supply is scheduled to be unlocked on that date.
Example of a Red Flag:
If the circulating supply is 100 million tokens, and the vesting schedule shows that 50 million founder/VC tokens unlock in a single month (a 50% supply increase), this is a catastrophic short-term risk, regardless of the project's utility. The market must immediately absorb a 50% increase in potential sellers.
Best Practice: Look for schedules that prioritize long, linear, and small releases over large, irregular lump-sum releases. The smoother the supply curve, the less risk of unexpected market disruption.
Case Study: Treasury Allocation and Use of Funds
While the vesting of VCs and founders is crucial, the Treasury allocation—tokens reserved for future development, grants, or ecosystem growth—warrants equal scrutiny.
Projects often reserve a significant portion of their supply (sometimes 20% to 40%) in a community treasury, managed by the core team or a decentralized autonomous organization (DAO).
What to Look For:
- Transparency: Is the treasury wallet address publicly known? Can you audit where the funds are going?
- Clear Mandate: Does the whitepaper detail how the treasury funds will be spent (e.g., grants for developers, marketing, liquidity provisioning)?
- Control: Who votes on the treasury allocation? If the initial team holds a majority of the governance power, they essentially control the funds, raising centralization concerns.
A well-designed treasury model ensures longevity and continuous development funding, but a poorly managed or opaque treasury is often a vector for unchecked insider spending.
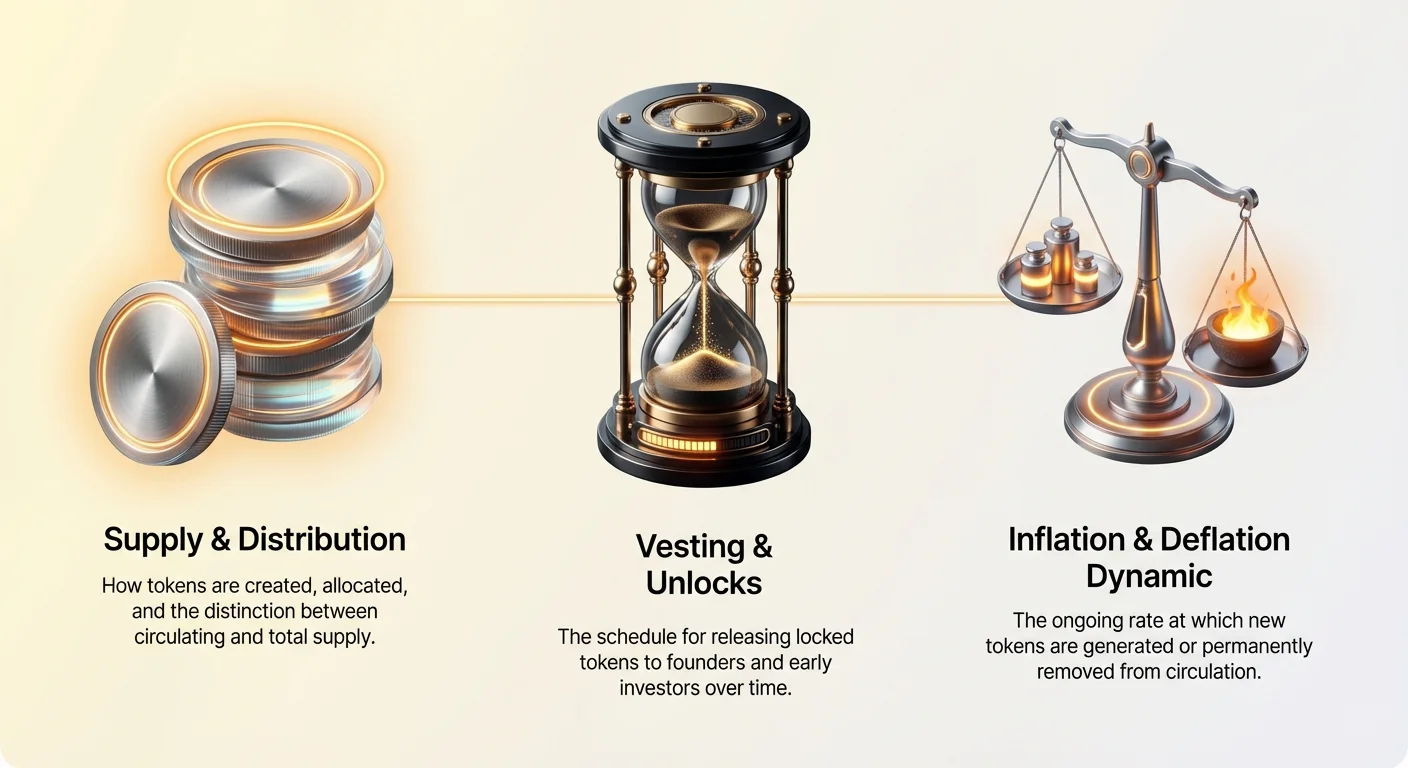
インフレーションとデフレーションのダイナミクス
初期のロック解除以降、新規トークンが作成されたり既存トークンが削除されたりする継続的な速度は、資産の長期的な価値保存能力を評価する上で不可欠です。
インフレーションモデル vs. デフレーションモデル
トークンの作成は、一般的にインフレーション型またはデフレーション型に分類されます:
- インフレーションモデル: 供給量が絶えず増加する(例:ステーキング報酬、ネットワークセキュリティ、またはマイニング報酬の支払いのためにトークンが継続的に鋳造される)。最終供給上限に達するまでブロックごとに新規コインを鋳造するBitcoinは、技術的にはインフレーション型です。
- 分析の焦点: 資産のユーティリティと需要はインフレーション率を上回る速度で成長できるか? ネットワークが年間10%の新規トークンを発行する場合、現在の価格を維持するだけでもネットワークの使用量は10%以上成長する必要があります。
- デフレーションモデル: 供給量が時間とともに減少する。通常、「バーン」メカニズム(トークンを永久に流通から除去する)を通じて行われます。
- 分析の焦点: バーン・メカニズムの有効性はどの程度か? ネットワーク活動(例:トランザクション手数料のバーン)と連動しているか、それとも一回限りのイベントか?
ステーキング報酬とエミッション率の評価
Ethereum(Merge後)やSolanaなどのLayer 1(L1)チェーンでは、セキュリティがしばしばステーキングによって保証され、ユーザーがトークンをロックしてトランザクションを検証します。その見返りとして、新規鋳造トークンであるステーキング報酬を受け取ります。
ここでインフレーションが経済的コストとなります:
- ソースの特定: ステーキング報酬が新規トークン発行(インフレーション)から来ているか、トランザクション手数料(持続可能)から来ているかを確認します。
- ネット効果の計算: 年間インフレーション率(新規鋳造トークンの量)とバーンされているトークンの量(しばしばトランザクション手数料の破壊を通じて)を比較します。
インフレーションの罠:
極めて高いステーキングAPY(例:50%や100%)を提供するプロジェクトは、しばしば大量のインフレーションでこれらの報酬を支払っています。名目上のトークン数は増加しますが、各トークンの価値が急速に希薄化します。トークンの価格がステーキング報酬の獲得速度を上回るペースで下落し、高い利回りを受け取っていても資本損失につながる可能性があります。高利回りはしばしば高い長期的な構造的リスクを示しています。
バーン・メカニズムの評価
デフレーション・メカニズムはインフレーションに対抗し、供給の希少性を減らすために設計されています。最も堅牢なバーン・モデルは、ネットワーク上の本物の経済活動に本質的に結びついたものです。
強力なバーン・メカニズム:
- トランザクション手数料バーン(例:EthereumのEIP-1559): すべてのトランザクション手数料の一部が永久に除去されます。これにより、ネットワーク使用量(需要)が増加するにつれてバーン速度が増加し、ユーティリティと希少性の間に直接的なつながりが生まれます。
- プロトコル収益バーン: エコシステム内の特定サービス(ドメイン名やNFTなど)の支払いに使用されたトークンがバーンされます。
弱いバーン・メカニズム:
- 手動または不定期バーン: コアチームが決定するバーン(例:「年に1回、国庫の5%をバーンします」)。これらは中央集権的で予測不能であり、継続的な希少性を生み出す効果が低いです。
分析ルール: トークノミクス・モデルが最も健康的であるのは、インフレーション発行(報酬)が主にデフレーション除去(手数料/バーン)でカバーされ、高需要期にネットゼロまたはネットネガティブのインフレーション率を目指す場合です。
ガバナンス:誰が船を制御するのか?
分散化は、しばしば暗号通貨の核心的な価値提案として挙げられます。しかし、トークノミクスがその分散化が本物か単なる名目上のものであるかを決定します。ガバナンスメカニズムは、ルールを変更し、資金を割り当て、プロトコルをアップグレードする権限を持つ者が誰かを規定します。
ガバナンスメカニズムのレビュー
ほとんどの現代の暗号通貨プロトコルは、オンチェーンガバナンスを利用しており、トークン保有者が提案に対して投票します。このシステムを分析するには、2つの重要な指標を理解する必要があります:
- クォーラム: 投票結果が有効とみなされるために、総流通供給量の最低パーセンテージが投票に参加しなければならないものです。低いクォーラム(例:2%)は、少数の積極的な少数派によって重要な決定が下されることを意味します。高いクォーラム(例:20%)は、より広範なコミュニティの合意を確保します。
- 閾値: 提案を可決するために必要な「Yes」投票の最低パーセンテージ。
中央集権化リスクの特定:
初期の創設者やVCのウォレットが、技術的に「ベスティング」中であっても重要なガバナンス権限を保有している場合、そのプロジェクトは高度に中央集権化されています。ガバナンスメカニズムが堅牢であるためには、権限が広く分散され、提案を可決するための障壁(クォーラム/閾値)が広範な合意を必要とするほど高くなければなりません。
権限集中と投票参加の分析
重要なステップは、トークンの分布、特に最大保有者(しばしば「クジラ」と呼ばれる)の監査です。
クジラの問題:
少数のウォレット(例:上位100)が流通供給量の過半数を制御している場合、クォーラムルールに関係なく、コミュニティのイニシアチブや投票を容易に圧倒できます。
分析の手順:
- ブロックエクスプローラーを使用: プロジェクトのブロックエクスプローラー(例:Etherscan)を使用して、トークン分布ページを表示します。
- 上位保有者を特定: 上位10または上位100の保有者を確認します。
- 既知のエンティティを確認: これらの大口ウォレットがコアチーム、VC、またはプロジェクトのトレジャリーに属するかどうかを判断します。投票権限の大部分が既知のインサイダーに集中している場合、そのプロジェクトは本物の分散化を欠いています。
実践的なヒント: 積極的で分散型のガバナンス参加の証拠を探します。提案はさまざまなコミュニティメンバーから提出されていますか? 投票は広く分散されていますか、それとも同じ少数のアドレスがすべての決定を支配していますか? 高い参加率は、健康で自己規制的なコミュニティを示します。
完全希薄化時評価額(FDV)メトリクスの再考
以前にFDVを定義しましたが、比較分析のツールとして使用する必要があります。
アルトコインを分析する際、競合プロジェクトのFDVを比較することが、現在の時価総額を比較するよりも示唆に富むことが多いです。
シナリオ:
- 競合A(成熟したL1): 時価総額500億ドル、FDV 600億ドル(供給量の95%がリリース済み)。
- 競合B(新しいL1): 時価総額50億ドル、FDV 500億ドル(供給量の10%がリリース済み)。
競合Bは表面上安価に見えます(50億ドルの時価総額)が、FDVを考慮すると、将来の供給を考慮した場合に確立された競合A(500億ドル対600億ドル)とほぼ同等の価格設定であることを示唆します。競合Bが競合Aの現在の時価総額(500億ドル)を達成するためには、現在の価格が10倍上昇しなければならず、かつ残りの90%のロックされたトークンからの売り圧力を成功裏に吸収しなければなりません。
この視点は、巨大なトークン希薄化イベントが避けられない場合に、投資家が低い現在の時価総額に誤誘導されるのを防ぎます。
結論
トークノミクスは構造的価値の厳密な研究です。それは、持続可能なビジネスモデルへの投資と一時的なハイプへの投機の違いにあります。供給ダイナミクス(FDV)、アンロックスケジュール(ベスティングクリフとリニアリリース)、インフレ圧力、中央集権化リスク(ガバナンスとトレジャリーコントロール)に対して批判的分析を適用することで、根本的なレッドフラグを見抜くための必要なツールを身につけることができます。自己主権が効果を発揮するためには、知的厳密さと組み合わせる必要があります。このフレームワークを使って、表面的なメトリクスを超え、検証可能で長期的な経済的持続可能性に基づいたポートフォリオを構築してください。