
ビットコインのような変動性の高い資産の価格変動を理解するには、ローソク足チャートを見るだけでは不十分です。伝統的な金融がマクロ経済レポートや企業の基礎データに大きく依存する一方で、暗号通貨市場は独自の利点を提供します:透明性です。すべての取引が公開台帳に記録されるため、洗練された投資家は市場の最も影響力のある参加者—供給の創出者、大口保有者、および取引が行われる取引所—の定量可能な行動を分析できます。
この分析アプローチは、価格の受動的な観察から、特定のアクターによって駆動される需給メカニズムの積極的な理解への焦点を移します。私たちは単純な評価モデルを超えて、短期的な圧力、蓄積パターン、および基盤となるネットワークの安定性を分析します。
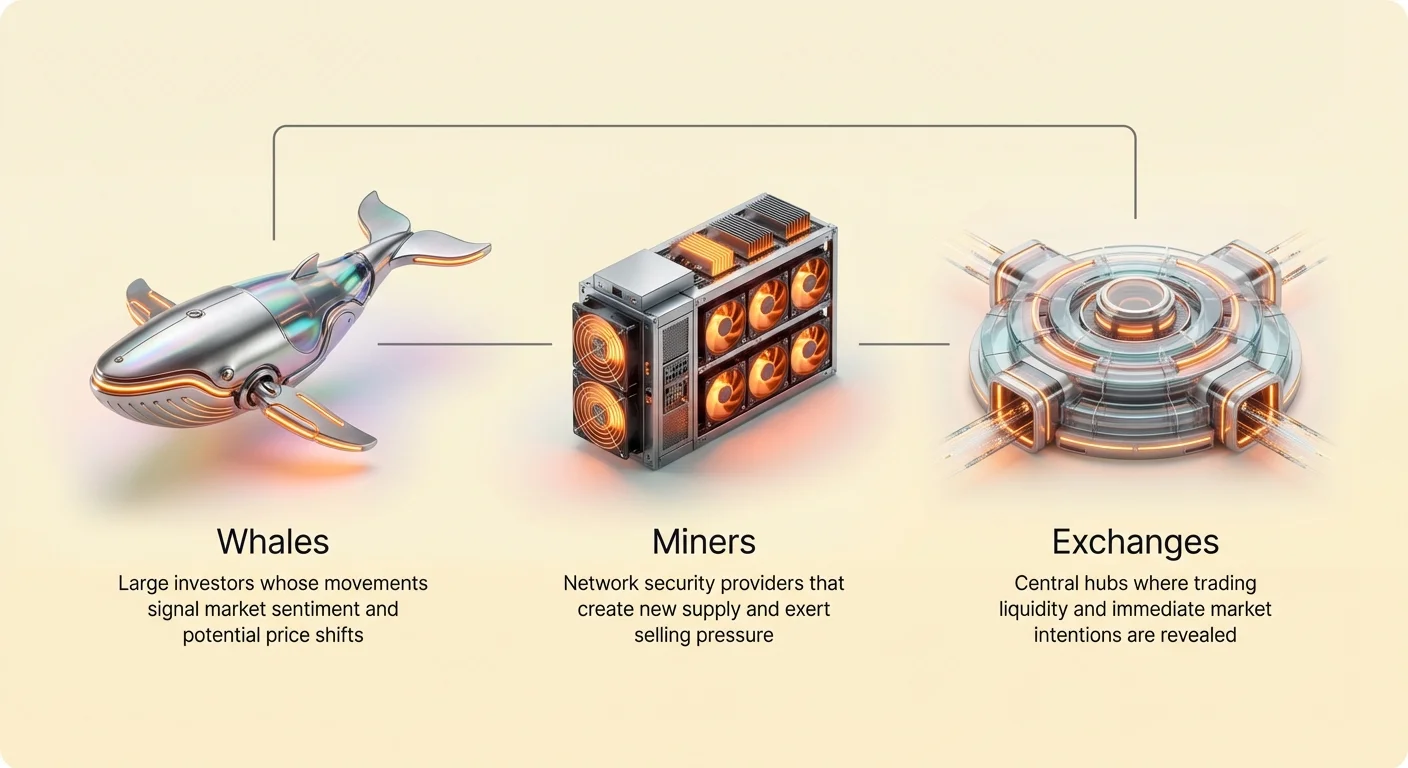
このガイドは、暗号通貨投資アナリストの視点を取り入れ、「クジラ」(大口投資家)、「マイナー」(ネットワークの基盤)、および「取引所フロー」(市場意図の即時脈動)の行動を追跡・解釈する方法を詳述し、堅牢な投資テーシスを構築します。
ビットコインのクジラの影響力:資金力のある保有者の追跡
あらゆる金融市場において、大規模投資家——市場を動かす規模から「クジラ」と呼ばれることが多い——は不相称な力を持っています。ビットコインでは、ブロックチェーン分析により、大量のBTCを保有するウォレットを監視できるため、これらのエンティティを追跡することが可能です。クジラの動きは、しばしば潜在的な自信や今後の分配イベントを示唆します。
「クジラ」ステータスの定義:ウォレット群と供給のセグメント化
ビットコインの「クジラ」とは、一般的に1,000 BTC以上(1つまたは複数の関連アドレスで)をコントロールするエンティティを指します。しかし、現代のオンチェーン分析では、全保有者をカテゴライズされた群に分けることで、より良くその影響力をセグメント化しています:
- エビ(1 BTC未満):個人小売投資家の大部分を占めます。累積保有量は大きいものの、個別の取引の影響は最小限です。
- カニ/タコ(10–100 BTC):中小投資家で、しばしばディップで最初に買い、急騰時に売却します。
- サメ/イルカ(100–1,000 BTC):富裕層個人や小規模機関。蓄積は本気の意図を示します。
- クジラ(1,000–5,000 BTC)と座頭クジラ(5,000 BTC超):これらは機関、ファンド、初期採用者で、低ボリューム期にその活動が市場センチメントと流動性を劇的に変動させます。
これらの特定群の集団的な蓄積または分配活動を追跡することで、アナリストは確信度を測ることができます。座頭クジラが大量蓄積している一方でエビが売却している場合、賢い資金が長期的な動きに向けてポジションを取っていることを示唆します。
クジラの行動分析:蓄積 vs. 分配
クジラ追跡から得られる主な指標は、時間経過に伴うネットポジション変化です。
蓄積:大口ウォレットが取引所からBTCを引き揚げ、私有の非カストディアルアドレス(コールドストレージ)に保有する場合、市場から売却可能な供給を効果的に除去します。これは自信と長期保有(HODLing)のコミットメントを示します。大口保有者の持続的な蓄積は、通常、供給減少により主要な上昇トレンドの前触れとなります。
分配:クジラが大量のBTCを中央集権型取引所に移動させる場合、通常売却準備を意味します。この流入は即時の短期売却圧力を加えます。大口の急激な入金スパイクは、地元の価格トップと相関しやすく、これらの大口保有者が急騰時に利益確定を取るためです。
実用的指標:ステーブルコインのフローと市場参入
BTCフローの追跡が不可欠な一方で、ステーブルコインの活動を監視することで、潜在的な需要に関する重要な先行指標が得られます。ステーブルコイン(USDTやUSDCなど)は、暗号エコシステム内の主なオンランプおよびオフランプ流動性を担っています。
クジラが大量のステーブルコインを取引所へ移動させる場合、差し迫った購買力を示唆します。彼らはBTCや他の資産を迅速に取得するための法定通貨相当の現金をポジションしています。逆に、大規模なステーブルコイン残高が取引所から引き出される場合、利益確定が完了し、資金がプライベートトレジャリーに移るか、暗号エコシステム外で決済されている可能性を示します。
大規模で協調的なステーブルコイン流入の分析は、しばしば大幅なラリーの前兆となり、資金力のある需要が市場に戻る強いシグナルを提供します。
ビットコインマイナーが供給とセキュリティで果たす重要な役割
ビットコインマイナーはネットワークの生産エンジンです。彼らはトランザクションを検証することでブロックチェーンを保護し、その対価として新しく発行されたBTC(ブロック報酬)プラス取引手数料を受け取ります。彼らの運用は市場における本質的な供給側の圧力を生み出します。
マイナー経済学の理解:コスト、収益、収益性
マイナーは厳しい利益率で運用される産業企業です。彼らの収益はブロック報酬(現在6.25 BTC、プラス手数料)によって完全に生成され、主なコストは電力、冷却、資本支出(ハードウェア)です。
これにより、継続的なマイナーの売り圧力が生じます。マイナーは運用コスト(「エネルギー上限」と呼ばれる)を賄うために、獲得したBTCの一部を頻繁に売却しなければなりません。BTCの価格が高い場合、彼らは報酬の小さな割合を売却するだけでコストを賄え、残りを蓄積できます。価格が下落したりネットワーク難易度が上昇したりすると、利益率が縮小し、より大きな割合を売却するか、蓄積した準備金さえ売却して溶解性を維持しなければなりません。
マイナーの売り圧力(「キャピチュレーション」イベント)
マイナーにとって最もストレスフルな時期であり、投資家にとって重要な分析シグナルはマイナー・キャピチュレーションです。キャピチュレーションは、マイニングコストが生成される収益を超えたときに発生し、非効率または過剰レバレッジのマイナーが機械を停止し、残りのBTC準備金を売却して債務を返済します。
これはHash Ribbonインジケーターなどの指標で測定され、ハッシュレートの30日移動平均と60日移動平均を追跡します。
- キャピチュレーション段階(弱気/底値シグナル):ハッシュレートが大幅に低下し(30日MAが60日MAを下回る)、多くのマイナーがオフラインになることを示します。市場はこれらのマイナーが準備金を清算する強制的な売り圧力を経験します。歴史的に、キャピチュレーション期間は売却の最終的で痛みを伴う波を示し、しばしば弱気市場サイクルの絶対的な底値と一致します。
- 回復段階(強気シグナル):弱いマイナーが排除されると、ハッシュレートが安定し、再び上昇し始めます。残ったより強靭なマイナーが報酬のより大きなシェアを獲得し、「マイナー回復」段階となります。この期間は通常、最悪の売却が終わり、新たな強気相場の舞台を整えることを確認します。
ハッシュレートとネットワークセキュリティを市場シグナルとして
ハッシュレート—ビットコインネットワークに捧げられた総計算能力—は、単なるマイナー収益性の指標ではなく、ネットワークのセキュリティと健全性の究極の測定基準です。
高く上昇するハッシュレートは、ネットワークが堅牢で分散化されており、攻撃が困難であることを確認します。投資家にとって、安定または増加するハッシュレートは、ビットコインの長期的な「価値の保存手段」およびセキュアな決済レイヤーとしての提案を支える重要なファンダメンタル要因です。ハッシュレートが価格補償なしに一貫して低下すれば、根本的な不安定性を示唆します。一方、ハッシュレートの新高値は、短期的な価格変動にかかわらず、ネットワークへの機関投資家および産業的なコミットメントの増加を示す非常に強気なシグナルです。
Exchange Flow Dynamics: The Window into Short-Term Intent
While whale activity provides insight into deep-pocketed sentiment, tracking exchange flow dynamics provides the clearest, most immediate view of short-term investor intentions and market liquidity. Centralized exchanges (CEXs) are the choke points where the majority of buying, selling, and leveraged trading takes place.
Net Position Change: Inflows vs. Outflows
The exchange net position change is arguably the most vital metric for short-term analysis. It measures the difference between the total BTC flowing onto exchanges (inflows) and the total BTC flowing off exchanges (outflows) over a set period.
- Net Inflow (Bearish Pressure): When BTC deposits significantly exceed withdrawals, it means people are moving coins from cold storage or personal wallets onto the exchange trading books. This action is usually taken in preparation to sell or trade, leading to an increase in available supply and, consequently, short-term selling pressure.
- Net Outflow (Bullish Signal): When withdrawals significantly exceed deposits, it signals that investors are pulling their BTC off exchanges and moving them into secure, private cold storage. This is a strong HODL signal, indicating that investors are unwilling to sell at current prices and are removing supply from the immediate market. Sustained net outflows are a prerequisite for major supply shocks and subsequent price rallies.
Exchange Balance Decline (The HODLing Signal)
The Total Exchange Balance is the cumulative amount of BTC held across all tracked centralized exchange wallets. This metric is a powerful proxy for aggregate market risk.
A continually declining exchange balance means that the total available supply of BTC that could be sold at any moment is shrinking. This signifies collective conviction and self-custody adoption. As the accessible liquid supply dwindles, the market becomes increasingly vulnerable to sharp upward moves when demand arrives—a fundamental supply shock dynamic.
Conversely, a rapidly rising total exchange balance suggests high uncertainty. Investors are parking large amounts of coins on exchanges, ready to sell immediately if sentiment turns negative, creating a latent overhang of selling pressure.
Analyzing Derivatives and Funding Rates
While spot market flows (actual BTC buying/selling) are the foundation, the derivatives market (futures and perpetual swaps) often dictates short-term volatility, especially through leverage.
Funding Rate: This is a small, periodic payment made between leveraged traders.
- Positive Funding Rate: Long traders (those betting on a price rise) are paying short traders. This means the market is overly bullish, aggressively leveraged long, and potentially overheated. High positive funding rates often precede a "long squeeze" or liquidation cascade.
- Negative Funding Rate: Short traders (those betting on a price drop) are paying long traders. This indicates the market is overly bearish. Extremely negative rates can signal a near-term bottom, as short sellers become susceptible to a swift "short squeeze."
Monitoring funding rates in conjunction with exchange flows allows analysts to gauge whether the selling pressure is spot-driven (actual liquidation) or derivative-driven (leveraged traders being wiped out).
Synthesizing the Data: Building a Market Thesis
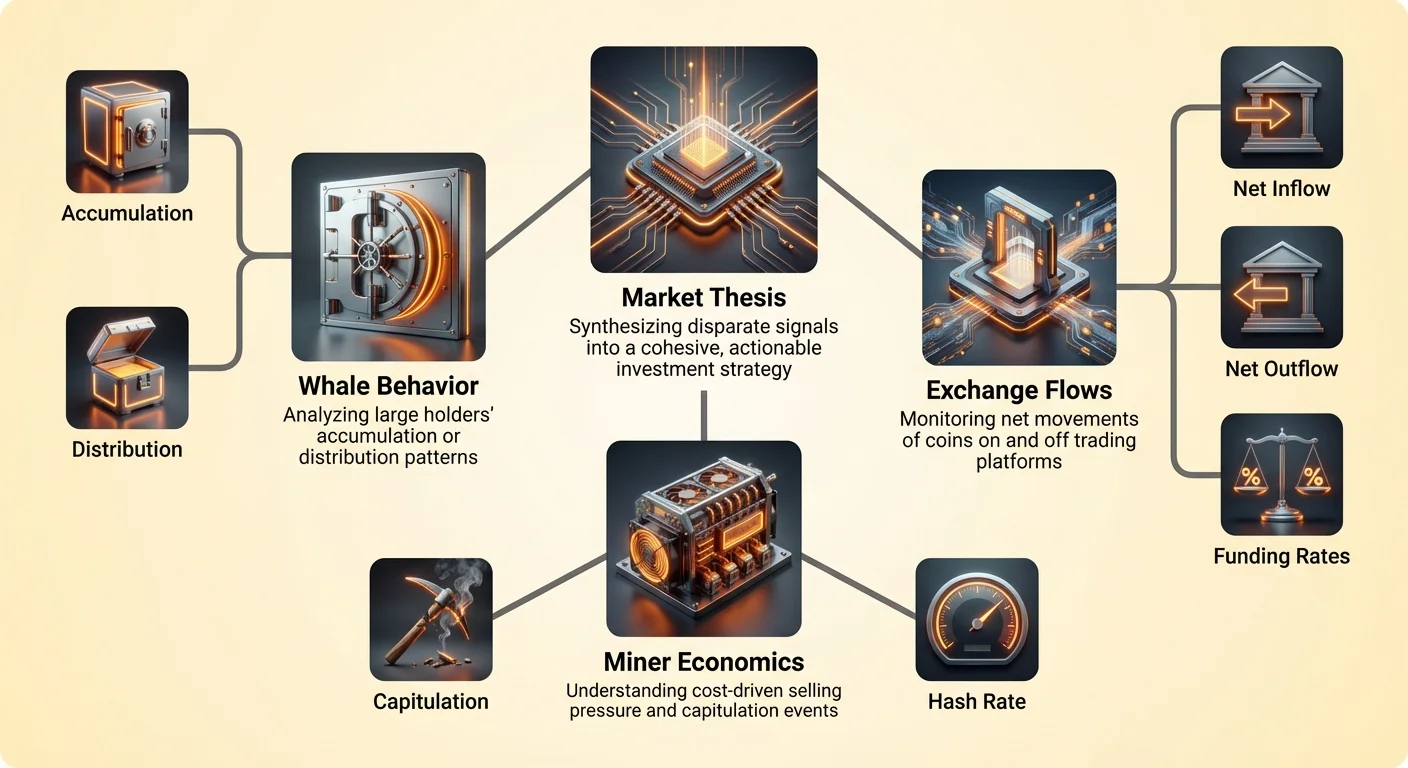
Analyzing whales, miners, and exchange flows in isolation provides partial insights. The true power of market structure analysis comes from synthesizing these disparate signals into a cohesive, actionable thesis.
Combining Whale, Miner, and Exchange Signals
The interactions between these three actors often explain rapid price movements that seem counterintuitive on simple price charts.
| Whale Activity | Miner Activity | Exchange Flow | Market Thesis |
|---|---|---|---|
| Accumulation (Holding) | Capitulation (Selling aggressively) | Net Outflow (Removing BTC) | STRONG BOTTOM SIGNAL: Whales are absorbing forced miner selling and moving coins to cold storage. Supply is shrinking while high conviction money enters. |
| Distribution (Depositing to sell) | Profitable (Low selling) | Net Inflow (Depositing to sell) | RISK OF CORRECTION: The largest holders are distributing supply into the market, suggesting a temporary top or desire to realize gains. |
| Neutral/Slight Accumulation | Profitable (Selling standard amount) | Total Balance Rising (Waiting) | UNCERTAINTY: Market is waiting for a catalyst. Liquidity is high, meaning small events could trigger large volatility. |
By cross-referencing these positions, an investor can determine if short-term bearish pressure (like miner selling) is being absorbed by high-conviction long-term holders (whales), or if that selling is compounding with broader market liquidation.
Key Risks and Limitations of On-Chain Analysis
While powerful, market structure analysis through on-chain data is not infallible and must be tempered with caution:
- Wallet Ownership Ambiguity: We can see what a wallet does, but we don't always know who controls it (e.g., Is it a hedge fund, an individual, or a corporate treasury like MicroStrategy?). This limits the certainty of "intent."
- Internal Transfers: Large movements of coins from one address to another might not be a sale but simply an exchange shuffling cold storage, or a custodian moving client funds. Analysts must use filtering heuristics to distinguish genuine market movement from internal operations.
- Black Swan Events: On-chain data primarily tracks organic supply and demand. It cannot predict sudden, non-quantifiable external events like regulatory crackdowns, global macro instability, or unexpected technological failures, which can override all accumulated technical signals.
To mitigate these limitations, market structure analysis should always be combined with macro frameworks discussed in pages like On-Chain vs. Macro Valuation Models and contextualized with knowledge of the major supply dynamics covered in Supply Shock Economics: Analyzing the Bitcoin Halving Cycle.
結論
ビットコインの価格はランダムウォークではない。それは、主要な市場参加者が取る定量可能な行動の観測可能な出力である。クジラによって駆動される資金の流れ、マイナーの基本的な経済性、および取引所の残高に反映された即時の圧力を研究することで、投資家は投機を超えて分析的な優位性を獲得する。
市場構造のアクターを追跡することで、投資家は供給がどこへ向かっているか(コールドストレージ対取引所)を理解し、短期的なボラティリティを生み出している誰か(レバレッジトレーダー対強制売却者)を把握できる。この洗練されたアプローチは、積極的な投資テーシスの基盤を形成し、ピークの熱狂と最大の苦痛の際に戦略的な決定を可能にする。受動的な観察から積極的な分析への転換は、デジタル経済における金融の自己主権への道筋における重要な一歩である。