
Razumijevanje kretanja cijena nestabilnih imovina poput Bitcoina zahtijeva više od samo gledanja grafikona svijećica. Dok se tradicionalne financije uvelike oslanjaju na makroekonomske izvještaje i fundamentalne podatke o tvrtkama, kripto tržište nudi jedinstvenu prednost: transparentnost. Budući da je svaka transakcija zabilježena na javnom ledgeru, sofisticirani investitori mogu analizirati kvantificirane radnje najutjecajnijih sudionika tržišta — stvaratelja ponude, velikih držaoca i burzi na kojima se odvija trgovanje.
Ovaj analitički pristup pomiče fokus s pasivnog promatranja cijene na aktivno razumijevanje mehanizama ponude i potražnje koje pokreću specifični akteri. Prelazimo izvan jednostavnih modela vrednovanja kako bismo analizirali kratkoročni pritisak, obrasce akumulacije i osnovnu stabilnost mreže.
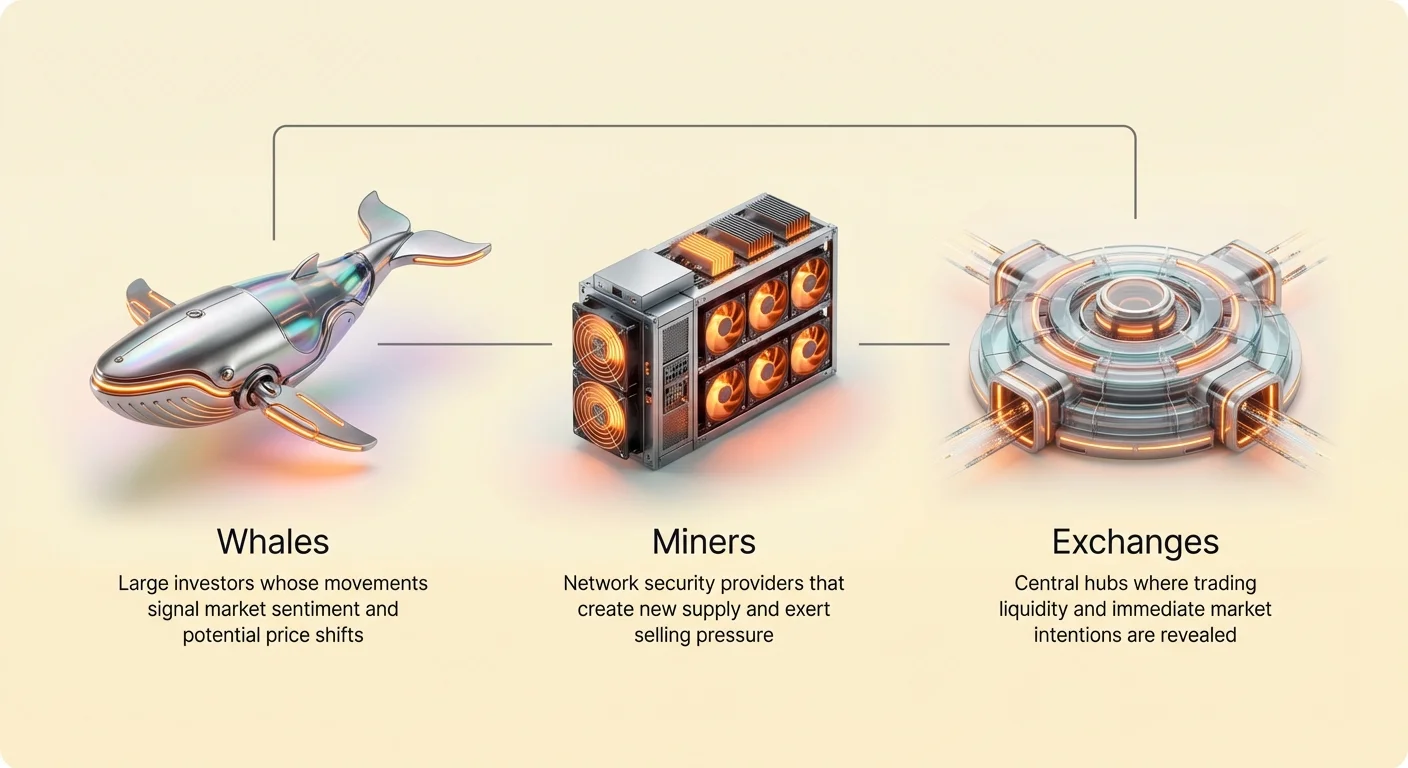
Ovaj vodič usvaja perspektivu analitičara za kripto investicije, detaljno objašnjavajući kako pratiti i tumačiti ponašanje „kitova“ (velikih investitora), „rudara“ (kičme mreže) i „protoka na burzama“ (odmah puls tržišne namjere) kako bismo izgradili robusnu investicijsku tezu.
The Influence of Bitcoin Whales: Tracking Deep-Pocketed Holders
In any financial market, large-scale investors—often called "whales" due to their market-moving size—hold disproportionate power. In Bitcoin, tracking these entities is possible because blockchain analysis allows us to monitor wallets holding significant amounts of BTC. Whale movements often signal underlying confidence or pending distribution events.
Defining "Whale" Status: Wallet Cohorts and Supply Segmentation
A Bitcoin "whale" is generally defined as an entity controlling a large number of coins (often 1,000 BTC or more) across one or several related addresses. However, modern on-chain analysis segregates all holders into categorized cohorts to better segment their influence:
- Shrimps (Under 1 BTC): Represent the vast majority of individual retail investors. Their cumulative holdings are significant, but their individual trades have minimal impact.
- Crabs/Octopuses (10–100 BTC): Small-to-medium investors, often the first to buy in dips or sell during rallies.
- Sharks/Dolphins (100–1,000 BTC): High-net-worth individuals or smaller institutions. Their accumulation signals serious intent.
- Whales (1,000–5,000 BTC) and Humpbacks (5,000+ BTC): These are the institutions, funds, and earliest adopters whose activity can dramatically swing market sentiment and liquidity, particularly during periods of low volume.
By tracking the collective accumulation or distribution activity of these specific cohorts, analysts can gauge conviction levels. If Humpbacks are heavily accumulating while Shrimps are selling, it suggests smart money is positioning itself for a long-term move.
Whale Behavior Analysis: Accumulation vs. Distribution
The primary metric derived from whale tracking is the net position change over time.
Accumulation: When large wallets pull BTC off exchanges and hold it in private, non-custodial addresses (cold storage), they are effectively removing sellable supply from the market. This signals confidence and a commitment to HODLing (holding for the long term). Sustained accumulation by large holders typically precedes major uptrends, as the available supply shrinks.
Distribution: When whales move large quantities of BTC onto centralized exchanges, it usually means they are preparing to sell. This inflow adds immediate short-term selling pressure. Large, sudden spikes in whale deposits are often correlated with local price tops, as these large holders take profits into rallies.
Practical Metric: Stablecoin Flows and Market Entry
While tracking BTC flows is essential, watching stablecoin activity provides critical forward guidance regarding potential demand. Stablecoins (like USDT and USDC) act as the primary on-ramp and off-ramp liquidity within the crypto ecosystem.
When whales move massive amounts of stablecoins onto centralized exchanges, they are signaling imminent buying power. They are positioning fiat-equivalent cash to quickly acquire BTC or other assets. Conversely, when large stablecoin reserves are withdrawn from exchanges, it might suggest profit-taking is complete, and the funds are moving into private treasuries or being settled outside the crypto ecosystem.
Analyzing large, coordinated stablecoin inflows often acts as a precursor to significant rallies, providing a strong signal of deep-pocketed demand returning to the market.
The Critical Role of Bitcoin Miners in Supply and Security
Bitcoin miners are the production engine of the network. They secure the blockchain by validating transactions and, in exchange, receive newly minted BTC (the block reward) plus transaction fees. Their operations create the essential supply-side pressure in the market.
Understanding Miner Economics: Costs, Revenue, and Profitability
Miners are industrial businesses that operate on tight margins. Their revenue is generated entirely by the block reward (currently 6.25 BTC, plus fees), while their major costs are electricity, cooling, and capital expenditure (hardware).
This creates a constant miner selling pressure. Miners must frequently sell a portion of their earned BTC to cover their operational costs (known as the "energy ceiling"). When the price of BTC is high, they can cover costs by selling a smaller fraction of their reward, allowing them to accumulate the rest. When the price drops or the network difficulty increases, their profit margins shrink, forcing them to sell a larger percentage, or even their accumulated reserves, just to stay solvent.
Miner Selling Pressure (The "Capitulation" Event)
The most stressful period for miners—and a key analytical signal for investors—is miner capitulation. Capitulation occurs when the cost of mining exceeds the revenue generated, forcing less efficient or over-leveraged miners to shut down their machines and dump their remaining BTC reserves to pay off debts.
This is measured by metrics like the Hash Ribbon indicator, which tracks the 30-day and 60-day moving averages of the hash rate.
- Capitulation Phase (Bearish/Bottom Signal): When the hash rate drops significantly (the 30-day MA crosses below the 60-day MA), it signals that a large number of miners have gone offline. The market experiences forced selling pressure as these miners liquidate reserves. Historically, the capitulation period marks the final, painful wave of selling and often coincides with the absolute bottom of a bear market cycle.
- Recovery Phase (Bullish Signal): Once the weaker miners are flushed out, the hash rate stabilizes and begins to rise again. The remaining, more resilient miners command a larger share of the rewards, leading to a "miner recovery" phase. This period usually confirms that the worst selling is over and sets the stage for a new bull run.
Hash Rate and Network Security as a Market Signal
The hash rate—the total computational power dedicated to the Bitcoin network—is not just an indicator of miner profitability; it is the ultimate measure of the network's security and health.
A high and rising hash rate confirms the network is robust, decentralized, and difficult to attack. For investors, a stable or increasing hash rate is a crucial fundamental factor supporting Bitcoin’s long-term proposition as a reliable "store of value" and secure settlement layer. If the hash rate were to consistently decline without price compensation, it would suggest fundamental instability. Conversely, new all-time highs in hash rate are highly bullish, indicating increasing institutional and industrial commitment to the network, regardless of short-term price volatility.
Dinamika protoka na burzama: Prozor u kratkoročnu namjeru
Dok aktivnost kitova pruža uvid u raspoloženje dubokih džepova, praćenje dinamike protoka na burzama pruža najjasniji, najizravniji pogled na kratkoročne investitorske namjere i tržišnu likvidnost. Centralizirane burze (CEX-ovi) su usko grlo gdje se odvija većina kupnje, prodaje i trgovanja s polugom.
Neto promjena pozicije: Priljevi naspram odljeva
Neto promjena pozicije na burzi vjerojatno je najvažniji pokazatelj za kratkoročnu analizu. Mjeri razliku između ukupnog BTC-a koji ulazi na burze (priljevi) i ukupnog BTC-a koji izlazi s burzi (odljevi) tijekom određenog razdoblja.
- Neto priljev (medveđi pritisak): Kada depoziti BTC-a značajno premaše povlačenja, to znači da ljudi premještaju kovanice iz hladnog skladištenja ili osobnih novčanika na burzovne trgovačke knjige. Ova radnja se obično preduzima u pripremi za prodaju ili trgovanje, dovodeći do povećanja dostupne ponude i, posljedično, kratkoročnog pritiska prodaje.
- Neto odljev (bikovsko signal): Kada povlačenja značajno premaše depozite, signalizira da investitori povlače svoj BTC s burzi i premještaju ga u sigurno, privatno hladno skladištenje. Ovo je snažan HODL signal, ukazujući da investitori nisu voljni prodavati po trenutnim cijenama i uklanjaju ponudu s trenutnog tržišta. Održani neto odljevi su preduslov za velike šokove ponude i naknadne rast cijena.
Pad stanja na burzama (Signal HODLinga)
Ukupno stanje na burzama ukupna je količina BTC-a zadržana na svim praćenim novčanicima centraliziranih burzi. Ovaj pokazatelj snažna je zamjena za agregirani tržišni rizik.
Kontinuirano opadajuće stanje na burzama znači da se ukupna dostupna ponuda BTC-a koja može biti prodana u bilo kojem trenutku smanjuje. Ovo označava kolektivno uvjerenje i usvajanje samo-kustodije. Kako likvidna ponuda dostupna opada, tržište postaje sve ranjivije na oštre rastuće poteze kada potražnja stigne — fundamentalna dinamika šoka ponude.
Suprotno, brzo rastuće ukupno stanje na burzama sugerira visoku nesigurnost. Investitori parkiraju velike količine kovanica na burzama, spremni za trenutnu prodaju ako se raspoloženje okrene negativno, stvarajući latentni previs prodajnog pritiska.
Analiza derivata i stopa financiranja
Dok su protoci spot tržišta (stvarna kupnja/prodaja BTC-a) temelj, tržište derivata (futuresi i perpetualni swapovi) često diktira kratkoročnu volatilnost, posebno kroz polugu.
Stopa financiranja: Ovo je mala, periodično plaćanja između trgovaca s polugom.
- Pozitivna stopa financiranja: Trgovci long (oni koji ulažu na rast cijene) plaćaju trgovcima short. To znači da je tržište previše bikovsko, agresivno zaduženo long i potencijalno pregrijano. Visoke pozitivne stope financiranja često prethode „long iscijedi“ ili kaskadi likvidacija.
- Negativna stopa financiranja: Trgovci short (oni koji ulažu na pad cijene) plaćaju trgovcima long. Ovo ukazuje da je tržište previše medveđe. Ekstremno negativne stope mogu signalizirati dno u bliskoj budućnosti, jer short prodavači postaju osjetljivi na brz „short iscijedi“.
Praćenje stopa financiranja u kombinaciji s protocima na burzama omogućuje analitičarima da procijene je li pritisak prodaje vođen spotom (stvarna likvidacija) ili derivatima (trgovci s polugom koji se brišu).
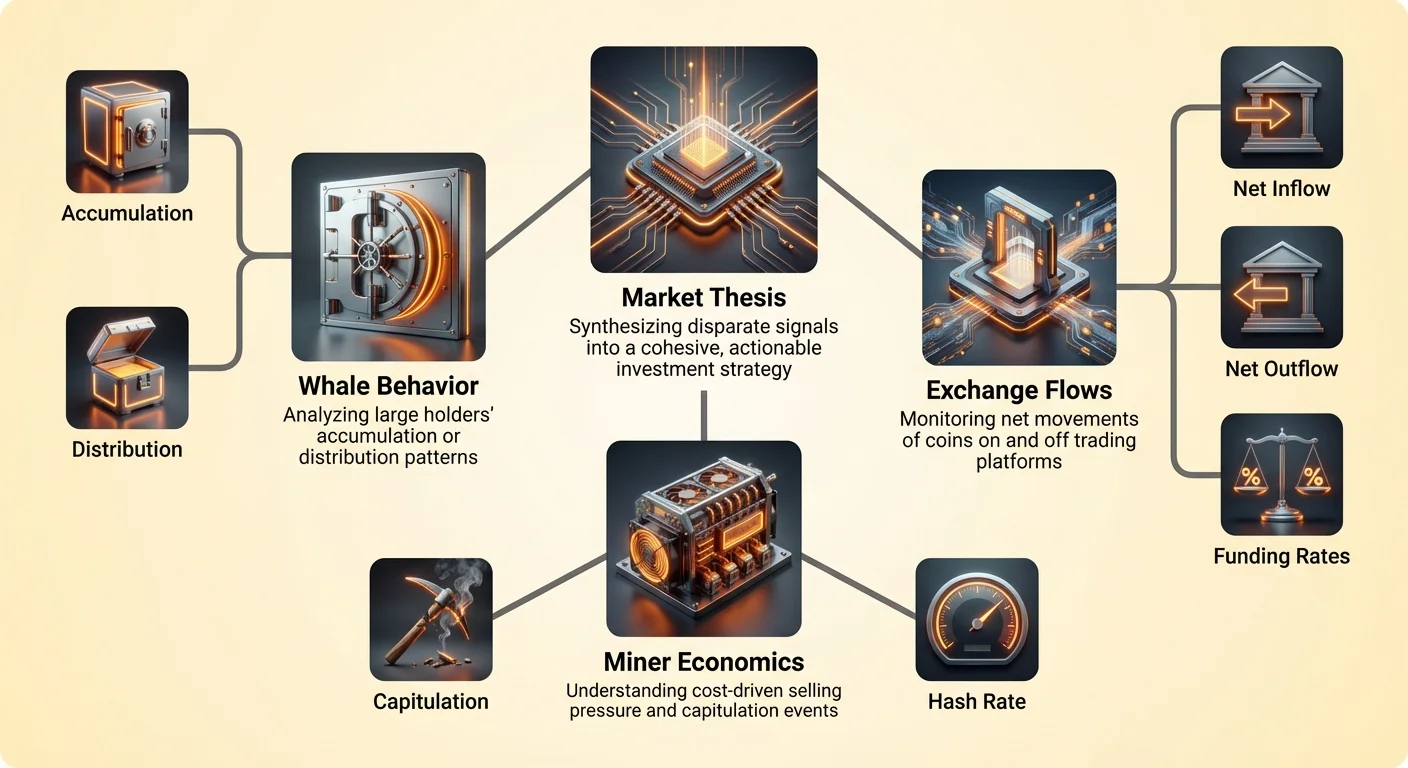
Synthesizing the Data: Building a Market Thesis
Analyzing whales, miners, and exchange flows in isolation provides partial insights. The true power of market structure analysis comes from synthesizing these disparate signals into a cohesive, actionable thesis.
Combining Whale, Miner, and Exchange Signals
The interactions between these three actors often explain rapid price movements that seem counterintuitive on simple price charts.
| Whale Activity | Miner Activity | Exchange Flow | Market Thesis |
|---|---|---|---|
| Accumulation (Holding) | Capitulation (Selling aggressively) | Net Outflow (Removing BTC) | STRONG BOTTOM SIGNAL: Whales are absorbing forced miner selling and moving coins to cold storage. Supply is shrinking while high conviction money enters. |
| Distribution (Depositing to sell) | Profitable (Low selling) | Net Inflow (Depositing to sell) | RISK OF CORRECTION: The largest holders are distributing supply into the market, suggesting a temporary top or desire to realize gains. |
| Neutral/Slight Accumulation | Profitable (Selling standard amount) | Total Balance Rising (Waiting) | UNCERTAINTY: Market is waiting for a catalyst. Liquidity is high, meaning small events could trigger large volatility. |
By cross-referencing these positions, an investor can determine if short-term bearish pressure (like miner selling) is being absorbed by high-conviction long-term holders (whales), or if that selling is compounding with broader market liquidation.
Key Risks and Limitations of On-Chain Analysis
While powerful, market structure analysis through on-chain data is not infallible and must be tempered with caution:
- Wallet Ownership Ambiguity: We can see what a wallet does, but we don't always know who controls it (e.g., Is it a hedge fund, an individual, or a corporate treasury like MicroStrategy?). This limits the certainty of "intent."
- Internal Transfers: Large movements of coins from one address to another might not be a sale but simply an exchange shuffling cold storage, or a custodian moving client funds. Analysts must use filtering heuristics to distinguish genuine market movement from internal operations.
- Black Swan Events: On-chain data primarily tracks organic supply and demand. It cannot predict sudden, non-quantifiable external events like regulatory crackdowns, global macro instability, or unexpected technological failures, which can override all accumulated technical signals.
To mitigate these limitations, market structure analysis should always be combined with macro frameworks discussed in pages like On-Chain vs. Macro Valuation Models and contextualized with knowledge of the major supply dynamics covered in Supply Shock Economics: Analyzing the Bitcoin Halving Cycle.
Zaključak
Cijena Bitcoina nije slučajni šetnja; to je promatran izlaz kvantificiranih radnji glavnih sudionika tržišta. Proučavanjem protoka koje pokreću kitovi, fundamentalne ekonomije rudara i trenutnih pritisaka odraženih u stanjima na burzama, investitori prelaze izvan spekulacija i dobivaju analitičku prednost.
Praćenje aktera strukture tržišta omogućuje investitorima razumijevanje gdje ide ponuda (hladno skladištenje naspram burzi) i tko stvara kratkoročnu volatilnost (trgovci s polugom naspram prisilnih prodavača). Ovaj sofisticirani pristup čini temelj proaktivne investicijske teze, omogućujući strateške odluke tijekom vrhunca euforije i maksimalne boli. Ovaj pomak od pasivnog promatranja prema aktivnoj analizi ključan je korak na putu prema financijskoj samo-suverenosti u digitalnoj ekonomiji.