
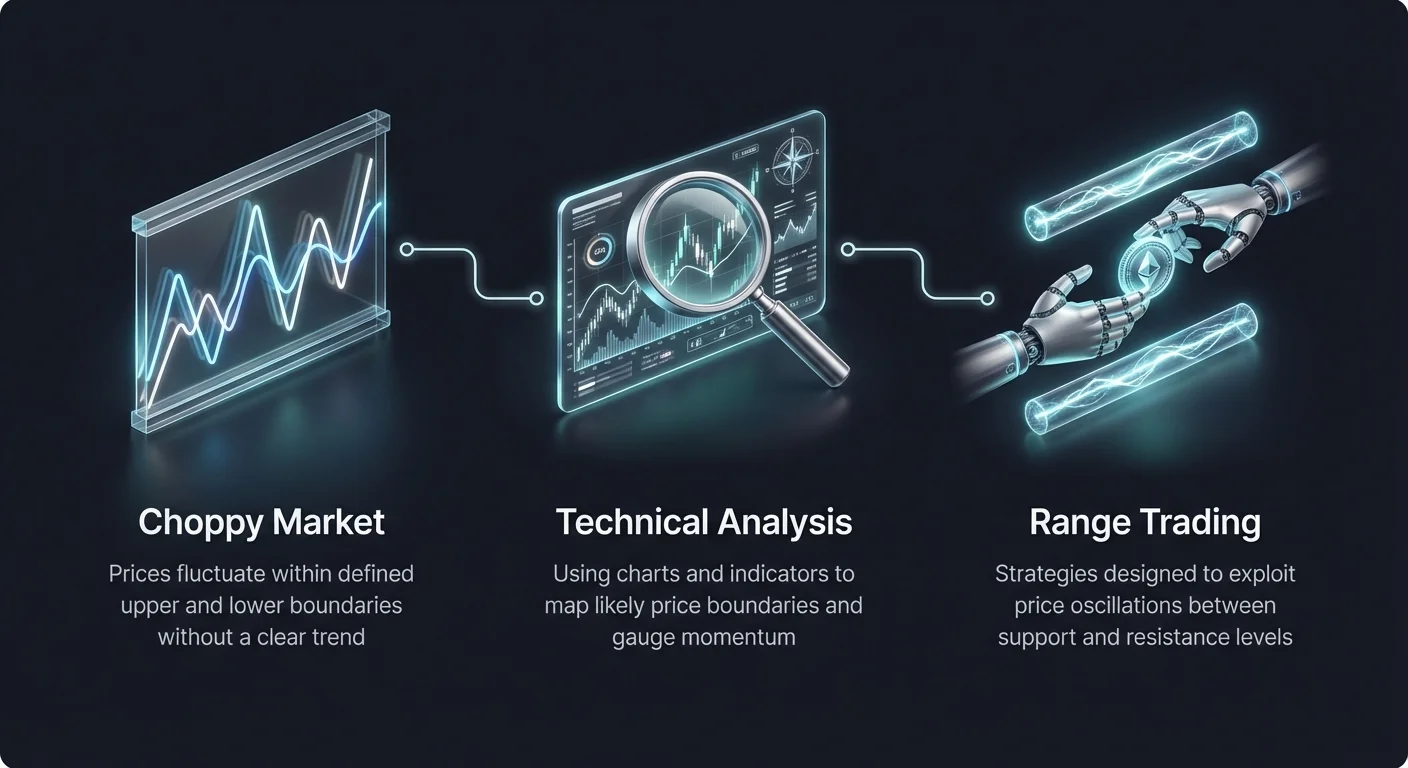
Navigating the cryptocurrency market requires more than just identifying strong upward or downward trends. A significant portion of market activity occurs within sideways ranges, often referred to as choppy markets. During these periods, prices fluctuate within defined upper and lower boundaries without establishing a clear long-term trajectory.
Traders who rely solely on trend-following strategies may find these environments frustrating, as the signals that work in bull or bear markets often result in losses during consolidation. To succeed in these conditions, market participants must adopt specific strategies designed to exploit price oscillations rather than directional momentum.
Understanding Market Conditions
The first step in managing a choppy market is recognizing when the asset has entered a period of consolidation. Unlike trending markets where price action makes consistent higher highs or lower lows, a sideways market is characterized by indecision. Buyers step in at a perceived value floor, known as support, while sellers offload assets at a price ceiling, known as Mastering Support, Resistance.
This tug-of-war creates a horizontal channel. Recognizing this structure early prevents traders from entering positions based on false breakouts. Tools that measure market noise and price variance become essential in validating whether a trend has stalled.
The Role of Technical Analysis
Technical analysis serves as the primary toolkit for navigating these non-trending periods. By utilizing historical price data and volume, traders can map out the likely boundaries of the current range. This involves more than just drawing lines on a chart. It requires a deep understanding of how price action behaves relative to its recent history.
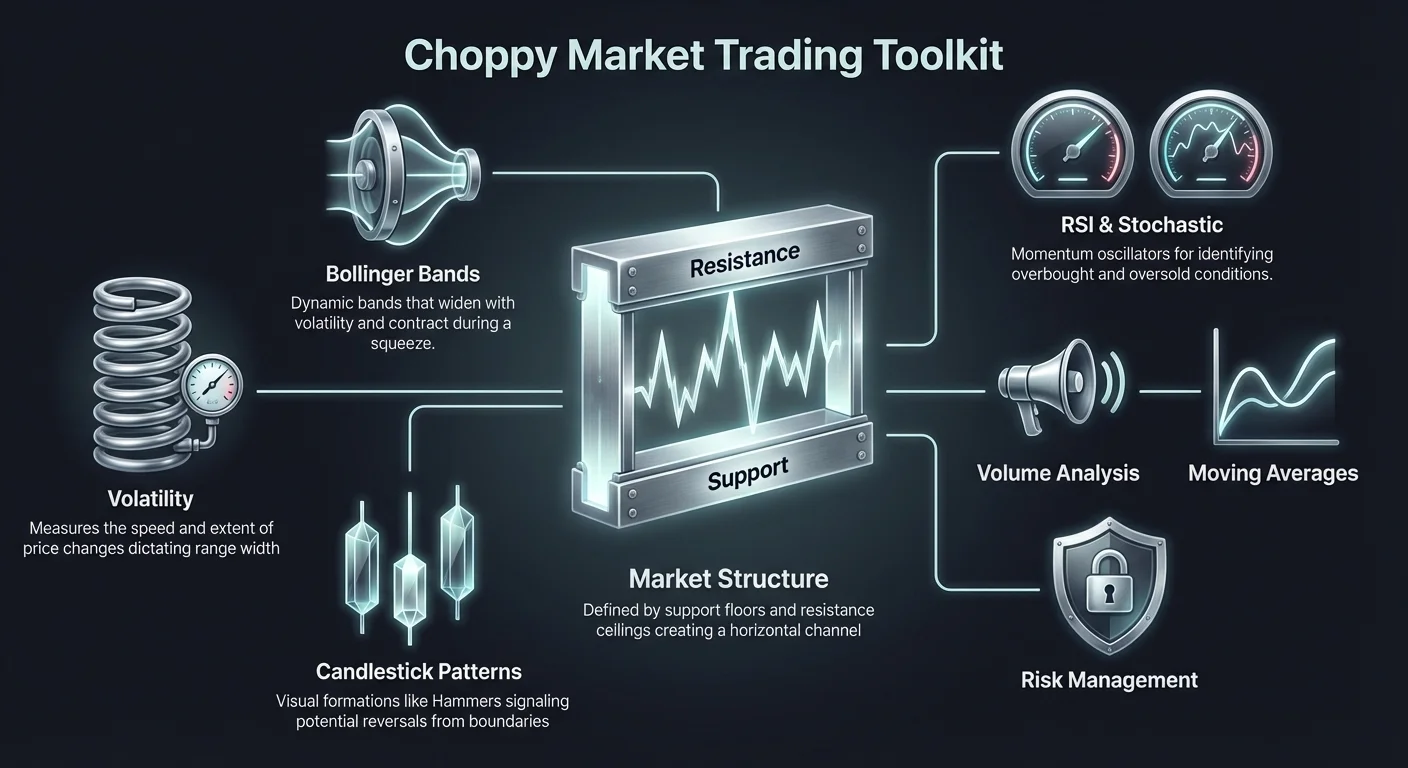
Indicators that adjust for volatility, such as Bollinger Bands, along with momentum oscillators like the Relative Strength Index (RSI), provide objective data points. These tools help traders differentiate between a simple pause in a trend and a prolonged period of sideways chop.
Decoding Volatility in Range Trading
Volatility is a measure of the speed and extent of price changes within a specific timeframe. In financial terms, it quantifies how much the price of an asset deviates from its average. Understanding volatility is crucial for range trading because it dictates the width of the trading channel and the potential risk involved.
High volatility equates to a "roller-coaster" market with sharp, rapid price swings. While this increases the risk of sudden losses, it also widens the potential profit margins within a range. Conversely, low volatility environments are steadier, resembling a gentle boat ride, but offer smaller price differentials for traders to capture.
Volatility is not static. It fluctuates based on economic events, news cycles, and market sentiment. A common mistake in choppy markets is assuming volatility will remain constant. Traders must constantly monitor metrics like standard deviation to gauge if the market is tightening (losing volatility) or expanding (gaining volatility).
A tightening market often precedes a violent move, while an expanding market may signal that the range is becoming unstable. By measuring these shifts, traders can adjust their expectations for how far price might travel before reversing at a support or resistance level.
Visualizing Price Action with Charts
To effectively trade a choppy market, one must be proficient in reading different types of charts. The visual representation of price data provides the raw material for all subsequent analysis. While line charts offer a simple overview of closing prices, they lack the detail necessary for precise range trading.
Bar charts provide more data by showing the opening, closing, high, and low prices for a given period. This detail allows traders to see the full extent of volatility within a specific timeframe. However, they can be difficult to read quickly.
Candlestick Charts
Most crypto traders prefer candlestick charts because they combine visual clarity with detailed data. Each candlestick tells a story about the battle between buyers and sellers over a specific interval. The body of the candle shows the difference between the open and close, while the wicks (or shadows) reveal the extreme high and low prices reached.
In a range-bound market, the wicks are particularly important. Long wicks protruding from support or resistance levels indicate rejection. For example, a long lower wick at the bottom of a range suggests that sellers tried to push the price down, but buyers aggressively stepped in to push it back up.
Identifying Reversal Patterns
Specific candlestick patterns can signal that a price swing within a range is about to reverse. A "Hammer," characterized by a small body and a long lower wick, often signals a potential bounce from support. Conversely, a "Shooting Star," with a small body and long upper wick, can indicate a reversal from resistance. This requires Grading Patterns Based on Crypto Market Context.
Recognizing these patterns allows traders to time their entries and exits more precisely. Instead of guessing where the turn might happen, they wait for the chart to provide visual confirmation that the momentum is shifting back toward the center of the range.
Utilizing Bollinger Bands for Dynamic Channels
Bollinger Bands are a technical indicator specifically designed to display price volatility and help identify potential breakouts or reversals. They consist of a central moving average flanked by two outer bands. These outer bands are calculated based on standard deviations from the central average.
When the market is choppy, these bands act as dynamic support and resistance levels. As volatility increases, the bands widen, accommodating larger price swings. When volatility decreases, the bands contract. In a range-bound scenario, price action often oscillates between the upper and lower bands.
The Squeeze and Expansion
One of the most powerful signals provided by this tool is the "squeeze." This occurs when the bands move closer together, indicating a period of low volatility. While range traders thrive on oscillation, a squeeze often warns that the range is about to break.
A squeeze is typically followed by a period of high volatility. If the price breaks decisively through the upper or lower band after a squeeze, it suggests the choppy period is ending and a new trend is beginning. For range traders, the squeeze is a signal to exercise caution or exit positions, as the predictable oscillation is likely to cease.
Trading the Bounce
During a stable sideways market, the upper and lower bands serve as excellent target zones. When the price touches or briefly exceeds the upper band, it may be overextended, signaling a selling opportunity. Conversely, a touch of the lower band often indicates the asset is oversold relative to its recent range, presenting a buying opportunity.
Traders should look for confirmation signals when price hits these bands. A touch of the lower band accompanied by a bullish candlestick pattern, such as a Hammer, reinforces the probability of a bounce. This combination of volatility analysis and price action increases the reliability of the trade setup.
Gauging Momentum with the Relative Strength Index
The Relative Strength Index (RSI) is an oscillator that measures the speed and strength of price movements. It moves on a scale from 0 to 100 and is invaluable for identifying overbought and oversold conditions within a choppy market.
In a trending market, the RSI can remain overbought or oversold for long periods. However, in a sideways market, the RSI tends to oscillate more predictably, making it a prime tool for range trading strategies.
RSI Boundaries
Traditionally, an RSI reading above 70 indicates that an asset is overbought and may be due for a pullback. A reading below 30 suggests the asset is oversold and could be poised for a rebound. In a choppy market, these levels align well with the upper and lower boundaries of the price range.
Traders can use these values to time their entries. If the price hits resistance and the RSI is above 70, the likelihood of a downward reversal increases. If price hits support and the RSI is below 30, the probability of a bounce improves.
Spotting Divergences
RSI divergences occur when the price action and the momentum indicator move in opposite directions. A bullish divergence happens when the price makes a lower low, but the RSI makes a higher low. This signals that while the price is dropping, the selling momentum is weakening.
A bearish divergence occurs when price makes a higher high, but RSI makes a lower high, indicating fading buying power. Detecting these divergences near the edges of a trading range can provide an early warning of a reversal, allowing traders to enter or exit before the price action turns significantly. A comprehensive guide can help with Decoding Hidden Signals.
Precision Timing with the Stochastic Oscillator
The Stochastic Oscillator is another momentum indicator that compares a closing price to its price range over a specific period. Like the RSI, it is range-bound between 0 and 100, but it is often more sensitive to market movements. This sensitivity makes it particularly useful in choppy markets where price swings may be rapid but short-lived.
The indicator consists of two lines: the %K line (the main measure) and the %D line (a moving average of %K). The interaction between these lines provides specific buy and sell signals.
| Signal Type | Description | Market Implication |
|---|---|---|
| Overbought | Reading above 80 | Price may be overextended; potential sell zone |
| Oversold | Reading below 20 | Price may be undervalued; potential buy zone |
| Bullish Cross | %K crosses above %D | Upward momentum is building |
Interpreting Crossovers
Crossovers are a primary signal mechanism for the Stochastic Oscillator. A bullish signal is generated when the %K line crosses above the %D line, particularly when both are in the oversold territory (below 20). This suggests that momentum is shifting upward from a bottom.
Conversely, a bearish signal occurs when the %K line crosses below the %D line while in overbought territory (above 80). This crossover indicates that the upward momentum has exhausted itself and a downward move is likely.
Filtering Signals
Because the Stochastic Oscillator is sensitive, it can produce false signals. To mitigate this, traders often wait for the indicator to exit the extreme zones before acting. For example, rather than buying the moment the lines cross below 20, a trader might wait for them to cross back above 20.
This confirms that the reversal has actually started, rather than just indicating a pause in selling pressure. In choppy markets, this confirmation step can prevent traders from buying into a falling knife or selling into a strong breakout.
Volume Analysis for Confirmation
Trading volume represents the total amount of an asset traded within a set period. It is a critical tool for confirming the validity of price movements within a range. Volume acts as a lie detector for price action, especially when Validating Breakouts and Avoiding Fakeouts.
In a healthy trend, volume should increase in the direction of the trend. In a choppy market, volume analysis helps identify whether a move toward the range boundary is a genuine breakout attempt or a "fakeout."
Volume at Boundaries
When price approaches the upper resistance level of a range, traders should watch volume closely. A breakout on low volume is suspicious and often fails. This lack of participation suggests that the "smart money" is not supporting the move to higher prices.
Conversely, if price rejects resistance on high volume, it indicates strong selling pressure defending that level. This validates the resistance and strengthens the case for a reversal back toward the center of the range.
Liquidity and Slippage
Volume also correlates with liquidity. In choppy markets, liquidity can sometimes dry up, leading to slippage—where trades are executed at a different price than expected. High volume ensures there are enough buyers and sellers to execute orders efficiently.
Low liquidity periods can be dangerous for range traders because small orders can cause disproportionate price jumps. Monitoring volume trends ensures that the market has enough stability to respect the established support and resistance levels.
Moving Averages in Sideways Markets
Moving averages (MAs) smooth out price data to create a single flowing line, making it easier to identify the direction of the trend. However, in choppy markets, moving averages can be misleading if used incorrectly. Because they are lagging indicators, they react to past data.
In a sideways market, price frequently crosses above and below the moving average. This can generate "whipsaw" signals, where a trader is triggered to buy just as the price peaks and sell just as the price bottoms. This is why strict Leveraging MA Ribbons is difficult in choppy markets.
The Golden and Death Crosses
Two famous MA patterns are the Golden Cross (50-day MA crossing above the 200-day MA) and the Death Cross (50-day MA crossing below the 200-day MA). While these are powerful signals for long-term trends, they are less effective in short-term chop.
In a defined range, these lines may flatten out and converge. Rather than using them for entry signals, traders in choppy markets often use long-term MAs (like the 200-day) as a baseline for the range. If the price is oscillating around the 200-day MA, it confirms the lack of a trend.
Dynamic Support
Shorter-term moving averages can still act as dynamic support or resistance within the range. For instance, if price bounces off the 50-day MA while remaining within the Bollinger Bands, it adds confluence to a trade setup.
Traders must be aware that in a strictly sideways market, moving averages lose much of their predictive power regarding direction. They become more useful as reference points for mean reversion strategies, where traders bet on the price returning to the average after an extension.
MACD: Convergence and Divergence
The Moving Average Convergence Divergence (MACD) is a trend-following momentum indicator. It tracks the relationship between two moving averages of a price. While primarily a trend tool, it can offer insights during choppy periods by signaling changes in momentum strength.
The MACD consists of the MACD line, the signal line, and a histogram. The interaction between these elements helps traders spot when a price swing within a range is losing steam.
Signal Line Crossovers
A bullish crossover occurs when the MACD line moves above the signal line. In a range, this can signal the start of an upswing from support. A bearish crossover, where the MACD drops below the signal line, suggests the start of a downswing.
However, because the MACD lags, these signals may arrive late in a tight range. By the time the crossover occurs, the price may have already moved halfway across the channel. Traders often look at the histogram, which reacts faster, to gauge the strengthening or weakening of momentum before the lines actually cross.
Zero Line Context
The zero line on the MACD represents the midpoint. When the MACD lines hover near zero, it confirms a lack of strong directional trend, consistent with choppy market conditions.
If the lines begin to diverge significantly from zero, it may indicate that momentum is building for a breakout. Monitoring the distance from the zero line helps traders distinguish between normal range oscillation and the potential onset of a new trend.
Fundamental and Sentimental Context
While technical analysis dominates range trading, fundamental and sentimental analysis provide the context for why the market is chopping. Fundamental analysis evaluates an asset's intrinsic value by looking at adoption rates, network activity, and macroeconomic factors.
A choppy market often reflects a balance in fundamental factors. For example, positive news about adoption might be offset by regulatory concerns, leading to a stalemate between bulls and bears.
Market Sentiment
Sentimental analysis gauges the mood of investors. Tools like the Fear & Greed Index or social media monitoring can reveal whether the market is fearful or optimistic. In a range, sentiment often flips rapidly.
Approaching the top of a range often coincides with spikes in greed or bullish social media activity (FOMO). Conversely, approaching the bottom often triggers fear. Contrarian traders use this to their advantage, selling when sentiment is overly euphoric at resistance and buying when fear peaks at support.
News Events
Major news events can act as catalysts that shatter a trading range. A range trader must be aware of upcoming economic calendars or regulatory announcements.
Volatility often spikes leading up to these events. Holding a range-bound position through a major news release is risky, as the resulting price move can be violent and unpredictable, easily gapping through stop-loss orders.
Risk Management Strategies
Trading choppy markets can be profitable, but it carries specific risks. The primary danger is a breakout. Eventually, every range resolves into a trend. If a trader is betting on the range continuing, a breakout can lead to significant losses if not managed properly. Calculating Position Size and Stop-Loss Placement using ATR is critical here.
Stop-loss orders are essential. In a range strategy, stops should be placed just outside the support or resistance levels. If the price breaks these levels, the thesis of the trade (that the range will hold) is invalidated, and the position should be closed.
Position Sizing
Position sizing is another critical component. Because the profit targets in a range are limited by the boundaries of the channel, traders cannot rely on massive 10x gains to offset losses. Consistency is key, requiring careful determination of Optimal Margin Sizing.
Traders should allocate only a controlled portion of their portfolio to any single trade. This prevents a series of "whipsaws"—where the market moves against a position briefly before reversing—from depleting trading capital.
Emotional Discipline
Psychology plays a massive role in sideways markets. The lack of clear direction can induce boredom or frustration, leading traders to force trades that aren't there.
Adhering to a strict set of rules—such as only trading when price touches the Bollinger Bands or when RSI is at an extreme—helps maintain discipline. Avoiding impulsive decisions driven by the desire for action is crucial for long-term survival in non-trending environments.
Integrating Strategy for Holistic Analysis
Successful trading in choppy markets rarely relies on a single indicator. The most effective strategies combine multiple tools to create a system of checks and balances. This holistic approach filters out weak signals and increases conviction in high-probability setups.
For example, a trader might identify a potential buy zone where the price touches the lower Bollinger Band. They then check the RSI to ensure it is below 30 and look for a bullish candlestick pattern like a Hammer.
Confluence
This layering of evidence is known as confluence. When three or four independent indicators all point to the same conclusion, the likelihood of a successful trade increases, especially when utilizing the Momentum Confirmation Stack.
If the lower Bollinger Band touch coincides with a support level from a moving average and an oversold reading on the Stochastic Oscillator, the signal is far stronger than any of these factors alone.
Continuous Learning
Markets evolve, and ranges change. A range that has held for weeks can break in an hour. Traders must remain adaptable, constantly re-evaluating the width of the channel and the validity of their indicators.
Continuous learning and practice are vital. Backtesting strategies on historical data helps traders understand how their tools perform in different volatility regimes. Staying informed about broader ecosystem developments ensures that traders are not caught off guard by fundamental shifts that could end the chop.
Conclusion
Navigating choppy markets requires a distinct shift in mindset from trend trading. By focusing on volatility, support and resistance boundaries, and momentum oscillators, traders can turn periods of market indecision into opportunities. Tools like Bollinger Bands provide the visual structure needed to define the playing field, while indicators like RSI and Stochastic help identify the optimal moments to strike.
However, technical tools are only part of the equation. Risk management remains the foundation of longevity. Understanding that every range eventually breaks ensures that traders protect their capital when market conditions shift. Combining these technical strategies with an awareness of market sentiment and fundamentals creates a robust approach to handling the unpredictable nature of sideways price action.
Consistency in choppy markets comes from patience, discipline, and trusting the data over emotions.