
Technical analysis in the cryptocurrency market relies heavily on identifying shifts in market sentiment before they become obvious trends. Among the various tools available to traders, candlestick patterns remain a primary method for visualizing the battle between buyers and sellers. While single-candle formations like Hammers or Shooting Stars provide immediate alerts, multi-candle patterns often carry greater weight regarding trend exhaustion. The Star patterns, specifically the Morning Star and Evening Star, stand out as three-candle formations that define market reversals with a distinctive structure of trend, indecision, and counter-attack.
Understanding the reliability of these formations requires more than just recognizing their shape on a chart. It involves analyzing the specific context in which they appear, the volume profiles accompanying them, and their relationship with key market levels. The "reliability index" of a Star pattern is not a fixed number but a dynamic value derived from how well the formation aligns with broader market conditions. Traders who can distinguish between a high-probability Star setup and a false signal often have a distinct edge in navigating volatile crypto assets.
This article provides a comparative analysis of Morning and Evening Star formations. We will dissect their structural components, evaluate the psychological shifts they represent, and identify the factors that enhance or diminish their success rates. By examining these patterns through the lens of risk and confirmation, market participants can better gauge when a trend is truly reversing or simply pausing before continuation.
Structural Anatomy of Star Formations
To evaluate the reliability of Star patterns, one must first understand the strict criteria that define them. These are not subjective shapes but specific sequences of price action that narrate a change in control. Both the Morning and Evening Star patterns unfold over three distinct sessions. This three-step process provides more data points than single-candle signals, which is a key factor in their perceived reliability.
Deconstructing the Morning Star
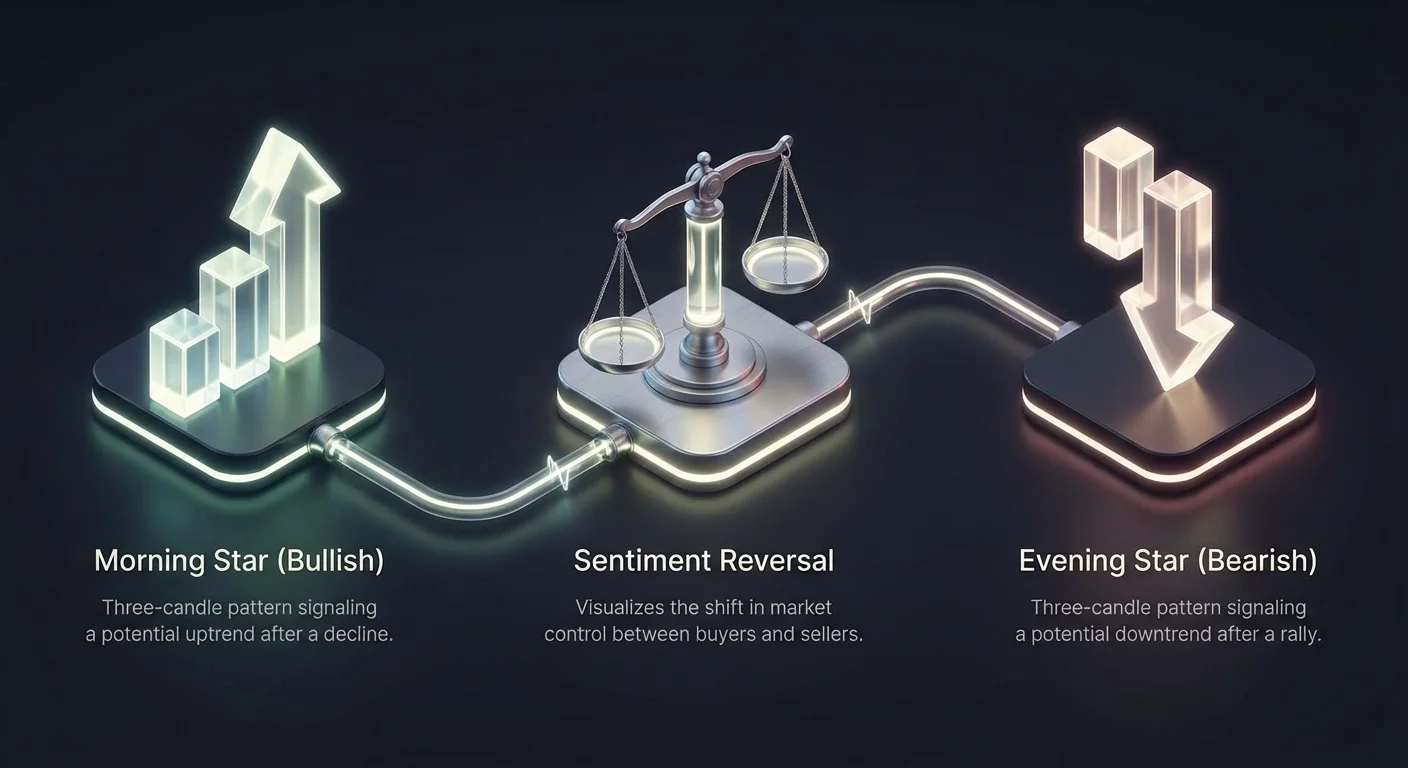
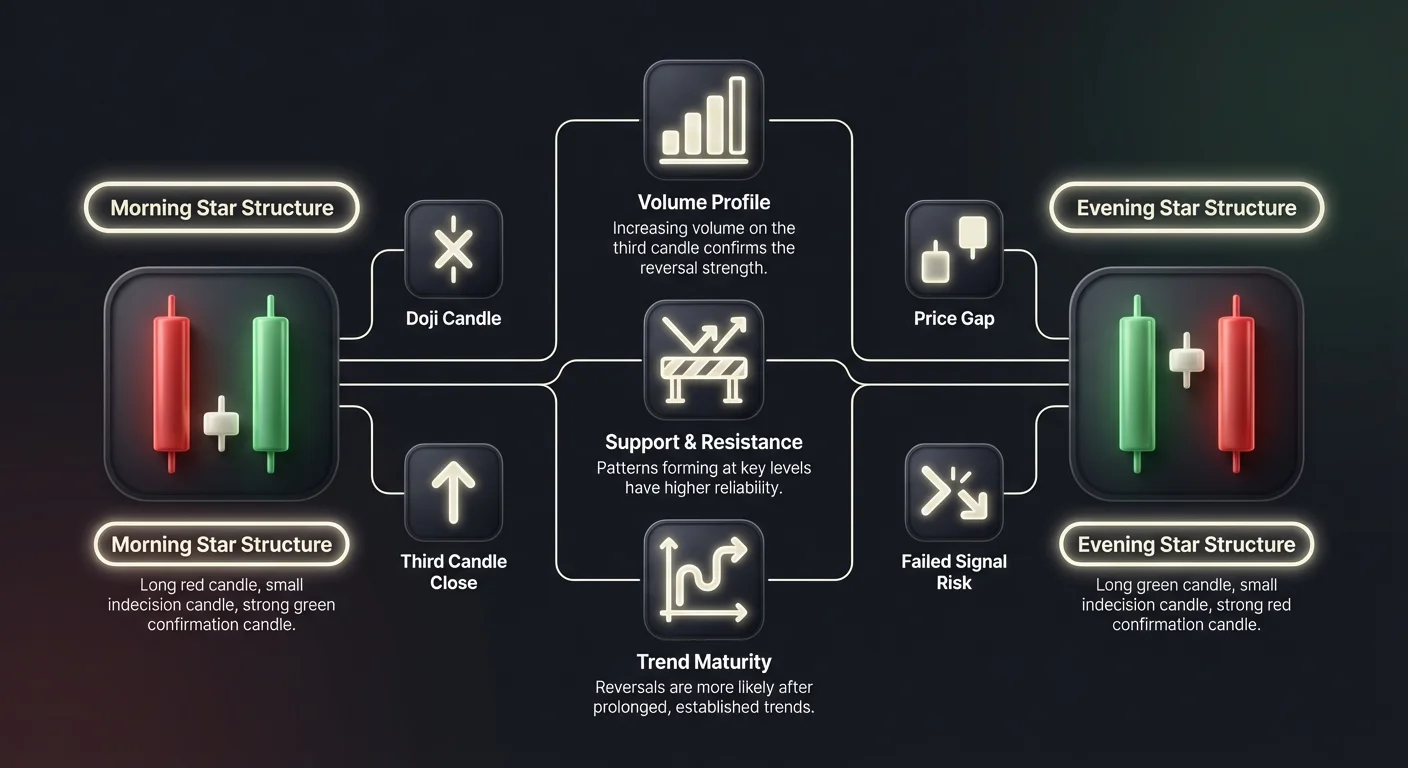
The Morning Star is a bullish reversal pattern that appears at the bottom of a downtrend. Its formation begins with a long red candle, which confirms that bears are currently in control and selling pressure is dominant. This first candle extends the existing decline, often inducing panic or capitulation among holders. The market sentiment at this stage is overwhelmingly negative.
The second component is the "star" itself. This is a small-bodied candle that signals a sudden drop in volatility and momentum. It indicates that while sellers are still present, they are no longer driving the price down aggressively. The color of this middle candle does not matter as much as its size. A small body reflects indecision, suggesting that the selling pressure has met equilibrium.
The final component is a strong green candle that closes well into the body of the first red candle. This third session is critical as it confirms that buyers have seized control from the sellers. Ideally, this candle should close above the midpoint of the first candle. This deep penetration signals a conviction to reverse the trend rather than just a temporary bounce.
Deconstructing the Evening Star
The Evening Star acts as the bearish mirror image, appearing at the peak of an uptrend. The pattern commences with a large green candle, reflecting strong buying interest and potentially over-enthusiastic market sentiment. During this first session, bulls are firmly in charge, often pushing prices to new local highs.
The middle candle reveals the first crack in the bullish armor. It is a small-bodied candle that gaps away from the previous close, indicating that despite the initial momentum, buyers cannot push the price significantly higher. This hesitation at the top of a trend is a warning sign. It suggests that demand is drying up or that supply is beginning to enter the market to absorb orders.
The completion of the pattern comes with the third candle, which is a long red candle. This session confirms the reversal by closing deep within the body of the first green candle. It demonstrates that sellers have overpowered the remaining buyers and are driving the price down. The structure signals that the uptrend has likely terminated and a move to the downside is imminent.
The Psychology of the Star Gap
A defining feature of high-reliability Star patterns is the "gap" or separation between the bodies of the candles, particularly involving the middle star. In traditional markets, true gaps are common due to market closes. In crypto, which trades 24/7, gaps are rarer and often manifest as distinct shifts in trading ranges rather than empty price space.
The middle candle represents a psychological truce. After a period of intense directional movement, the market pauses. This pause is not merely a lack of activity but a transfer of inventory. In a Morning Star, "smart money" may be accumulating positions from panic sellers. In an Evening Star, institutional players may be distributing assets to late-arriving retail buyers.
The reliability of the pattern increases when this middle candle is a Doji or has an extremely small body. A Doji signifies near-perfect equality between open and close prices, representing total indecision. When total indecision follows a strong trend, it implies the prevailing momentum is completely exhausted, making the subsequent reversal candle far more potent.
Factors Influencing Success Rates
Not all Star patterns result in profitable reversals. The success rate of these formations depends heavily on where they occur on the chart. Context is the primary filter for reliability. A Star pattern that forms in the middle of a sideways range is often noise, whereas one that forms at a trend extreme commands attention.
Trend Maturity and Location
For a Star pattern to be valid, a prior trend must exist. A Morning Star must follow a tangible decline, and an Evening Star must follow a clear rally. The maturity of this trend plays a role in the pattern's potential success. A pattern appearing after a prolonged, multi-week trend is generally more reliable than one appearing after a short, two-day move.
Support and resistance levels act as force multipliers for these signals. A Morning Star that forms precisely on a long-term support zone or historical low has a much higher probability of success. The technical support provides a floor for the price, while the candlestick pattern confirms that the floor is holding.
Conversely, an Evening Star forming at a known resistance level or a previous all-time high suggests a strong rejection. The confluence of a structural barrier with a reversal pattern creates a "double verification" of the signal. Traders often look for these confluences to filter out lower-quality setups that occur in "no man's land" between key levels.
Volume Profiles and Confirmation
Volume analysis is crucial for validating the strength of a Star pattern. Reliability increases significantly if the volume profile aligns with the price action. During the first candle of the pattern, volume should ideally be high, consistent with the prevailing trend. This shows that the trend is still active but potentially nearing a climax.
The middle "star" candle often sees a drop in volume, reflecting the hesitation and lack of conviction from either side. However, the most critical volume signal occurs on the third candle. For a Morning Star, the third green candle should be accompanied by a surge in buying volume. This proves that new capital is entering the market to support the reversal.
If the third candle moves price significantly but on low volume, the reliability index drops. It suggests a lack of genuine interest, warning that the move might be a "bull trap" or "bear trap." High volume on the reversal candle serves as the fuel that confirms the engine has switched directions.
Comparative Analysis: Stars vs. Single Candles
While Star patterns are powerful, they are often compared to single-candle reversals like the Hammer or Shooting Star. Understanding the differences in their reliability profiles helps traders choose the right tool for the specific market condition.
| Feature | Star Patterns (Morning/Evening) | Single Candles (Hammer/Shooting Star) |
|---|---|---|
| Duration | 3 Sessions | 1 Session |
| Complexity | High (Trend + Pause + Reversal) | Low (Intraday Rejection) |
| Confirmation | Built-in (Third Candle) | Requires Next Candle |
Signal Robustness
The primary advantage of Star patterns over single-candle formations is the built-in confirmation mechanism. A Hammer pattern, which signals a bullish reversal, consists of a single candle with a long lower wick. While it shows buyers stepping in, it does not guarantee they will hold the line in the next session.
In contrast, the Morning Star includes the confirmation within the pattern itself. The third candle serves the same function as a confirmation candle following a Hammer. By waiting for the completion of the full three-candle sequence, a trader effectively filters out many false signals that a single-candle trader might act upon prematurely.
However, this robustness comes with a cost: entry price. Because the Star pattern requires a third candle to close, the price has often moved further away from the bottom (or top) compared to a single-candle entry. Traders trade a slightly worse entry price for a higher probability of trend follow-through.
Market Noise Filtering
Crypto markets are notoriously noisy, with erratic price spikes common on lower timeframes. Single-candle patterns like the Shooting Star can sometimes be the result of temporary anomalies or "fat finger" trades that leave long wicks. These can occur without a genuine shift in market sentiment.
The three-session structure of Star patterns acts as a natural filter for this noise. It is much harder for random market noise to paint a coherent three-candle picture of trend, pause, and reversal. The requirement for sustained price action over three periods implies a more deliberate shift in market psychology, making the Star formation less susceptible to random volatility spikes.
This filtering capability makes Star patterns particularly useful on higher timeframes, such as the 4-hour, daily, or weekly charts. On these timeframes, the "story" told by the three candles represents significant capital flow shifts, whereas on a 1-minute chart, the same pattern might just represent a momentary pause in high-frequency trading algorithms.
Common Failure Scenarios
Even the most reliable technical patterns fail. Understanding why Morning and Evening Stars fail is just as important as knowing why they work. False positives can lead to significant losses if risk management is not applied.
The Shallow Retracement
One of the most common causes of failure is a lack of penetration by the third candle. In a Morning Star, if the third green candle fails to close above the midpoint of the first red candle, the signal is weak. It indicates that while buyers showed up, they lacked the strength to undo the damage of the initial sell-off.
Similarly, in an Evening Star, if the third red candle is small and does not push deep into the first green candle's territory, the bearish reversal is suspect. This "shallow" reversal often results in a consolidation or pennant formation rather than a true trend change. Traders often wait for a fourth candle to confirm if the third candle was insufficient.
Counter-Trend Trading Risks
Trading Star patterns often means trading against the prevailing trend. A Morning Star attempts to pick a bottom, while an Evening Star attempts to pick a top. In strongly trending markets, these reversal signals can be overrun by sheer momentum.
A "failed" Morning Star occurs when the price momentarily pauses and prints the pattern, only for the downtrend to resume immediately after. This is known as a continuation pattern disguised as a reversal. This risk is highest when trading against strong fundamental news or during capitulation events where technical logic is temporarily suspended by panic.
To mitigate this, traders rarely rely on the pattern alone. They look for the pattern to form at a logical area where the trend should theoretically pause or reverse, such as a Fibonacci extension level or a historical demand zone.
Enhancing Reliability with Indicators
To construct a true "reliability index" for a trade setup, professional traders layer additional technical indicators on top of the candlestick formation. These tools provide objective data to support the subjective interpretation of the chart pattern.
Momentum Oscillators
Oscillators like the Relative Strength Index (RSI) are excellent companions for Star patterns. A Morning Star is significantly more reliable if it forms when the RSI is in oversold territory (typically below 30). This confirms that the selling pressure has reached an extreme and a reversion to the mean is likely.
Conversely, an Evening Star carries much more weight if it appears when the RSI is overbought (above 70). If an Evening Star forms but the RSI is stuck in neutral territory (around 50), the market may simply be resting before pushing higher. The convergence of an overextended momentum reading with a reversal pattern creates a high-conviction setup.
Moving Averages as Dynamic Support
Moving averages can also serve as dynamic confirmation lines. A Morning Star that forms right as the price touches a rising 50-day or 200-day moving average is a classic "buy the dip" setup. The moving average confirms the long-term trend is up, while the Star pattern signals the end of the short-term correction.
For Evening Stars, a rejection at a declining moving average validates the bearish thesis. It suggests that the rally was merely a retest of the average, and the dominant downtrend is resuming. When the pattern and the dynamic resistance align, the probability of a successful trade increases.
Divergence Confirmation
Bullish or bearish divergence is arguably the strongest confirmation tool available. If price makes a lower low while the Morning Star forms, but the RSI makes a higher low, this bullish divergence signals underlying strength. It reveals that while price is dropping, the momentum behind the drop is dissipating.
Bearish divergence works similarly for the Evening Star. If price hits a new high during the pattern's formation but the oscillator fails to reach a new high, it indicates hollow buying power. A Star pattern triggered during divergence is often considered a "Grade A" setup by technical analysts.
Execution and Risk Management
Identifying a high-reliability Star pattern is only half the battle. Executing the trade with proper risk parameters is what determines long-term profitability. The structure of Morning and Evening Stars provides clear invalidation points, which simplifies trade management.
For a Morning Star, the standard stop-loss placement is just below the lowest point of the pattern, typically the low of the middle "star" candle. If price breaks this level, the pattern is invalidated, and the downtrend is likely continuing. There is no reason to stay in the trade if the reversal low is breached.
For an Evening Star, the stop-loss goes above the highest point of the formation. If buyers manage to push price above the "star," the bearish signal has failed. Keeping stops tight to these structural levels allows for favorable risk-to-reward ratios. Since the entry is taken after the third candle closes, the distance to the stop-loss is defined, allowing traders to calculate exact position sizes.
Some conservative traders wait for even more confirmation, such as a break of the third candle's high (for Morning Star) or low (for Evening Star). While this reduces the chance of a false start, it also widens the stop-loss distance and reduces the potential reward. Balancing the need for confirmation with the need for a good entry price is a constant negotiation in crypto trading.
Conclusion
The comparative success of Morning and Evening Star formations lies in their ability to narrate a complete story of market sentiment. Unlike single-candle patterns that offer a snapshot of intraday rejection, these three-candle structures illustrate the entire process of trend exhaustion, indecision, and counter-attack. Their reliability is not inherent but is derived from context—specifically their location relative to support and resistance, the volume accompanying the reversal, and the maturity of the preceding trend.
While broadly effective, neither pattern is a guarantee of future price action. The Morning Star serves as a beacon for potential accumulation zones during corrections, while the Evening Star warns of distribution at market peaks. The most successful applications of these patterns occur when they are used not as standalone triggers, but as part of a comprehensive trading system that includes momentum indicators, volume analysis, and strict risk management.
Success in trading Star patterns comes from waiting for the third candle to fully close and confirming the signal with volume.