
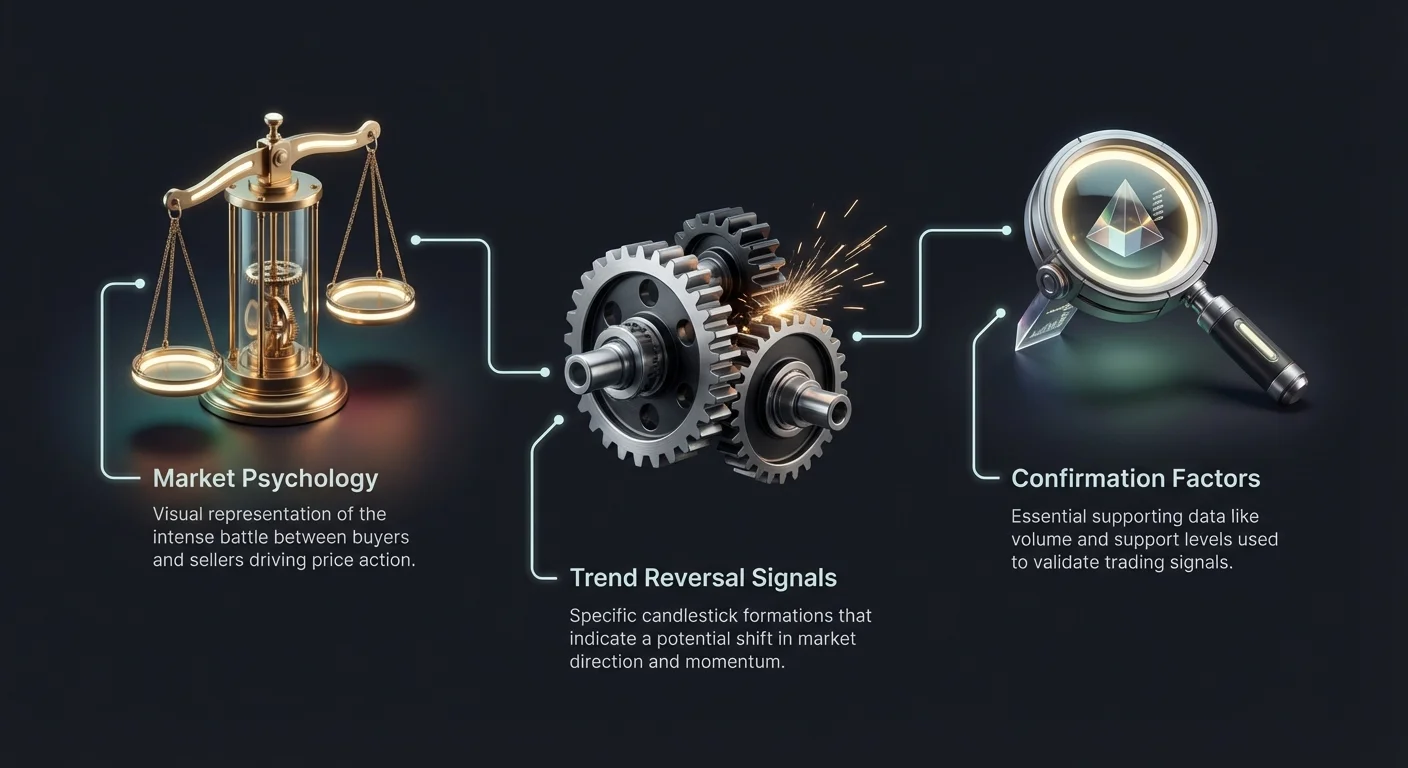
Cryptocurrency markets are defined by their volatility and rapid shifts in sentiment. For traders navigating this landscape, success often depends on the ability to interpret price action as it happens. While fundamental analysis provides a long-term view, technical analysis offers immediate insights into market psychology. At the core of this technical approach are candlestick patterns. These visual representations of price data do more than just track value. They tell a detailed story of the battle between buyers and sellers during a specific timeframe.
Understanding these patterns allows market participants to identify potential changes in momentum. A single candle or a group of candles can signal that a current trend is losing steam or that a new dominant force is entering the market. By recognizing specific formations, traders can locate high-probability entry points and manage risk with greater precision. This analysis moves beyond simple observation. It involves decoding the emotions of fear, greed, and indecision that drive market movements.
However, relying on candlesticks alone is rarely sufficient. The most effective strategies combine these visual signals with broader market context. This includes analyzing volume, identifying support and resistance levels, and utilizing technical indicators. When a specific candle pattern aligns with these other factors, the signal becomes significantly more reliable. This comprehensive approach helps traders distinguish between temporary fluctuations and genuine trend reversals.
The Psychology of Market Rejections
One of the most powerful signals in technical analysis is the rejection of a price level. This occurs when the market attempts to push the price in one direction but fails, resulting in a swift counter-move. In candlestick charting, this struggle is often captured by a single candle with a long wick and a small body. These formations, known as "pinbars" in some circles, provide a clear snapshot of intraday failure and recovery.
The anatomy of these candles reveals the sentiment of the session. The long wick represents the rejected price range, while the small body indicates that the open and close prices were relatively close together. The color of the body—whether red or green—adds another layer of information regarding who ultimately won the session. Understanding this structure is the first step in utilizing rejection patterns for trade entry.
The Rising Bullish Hammer
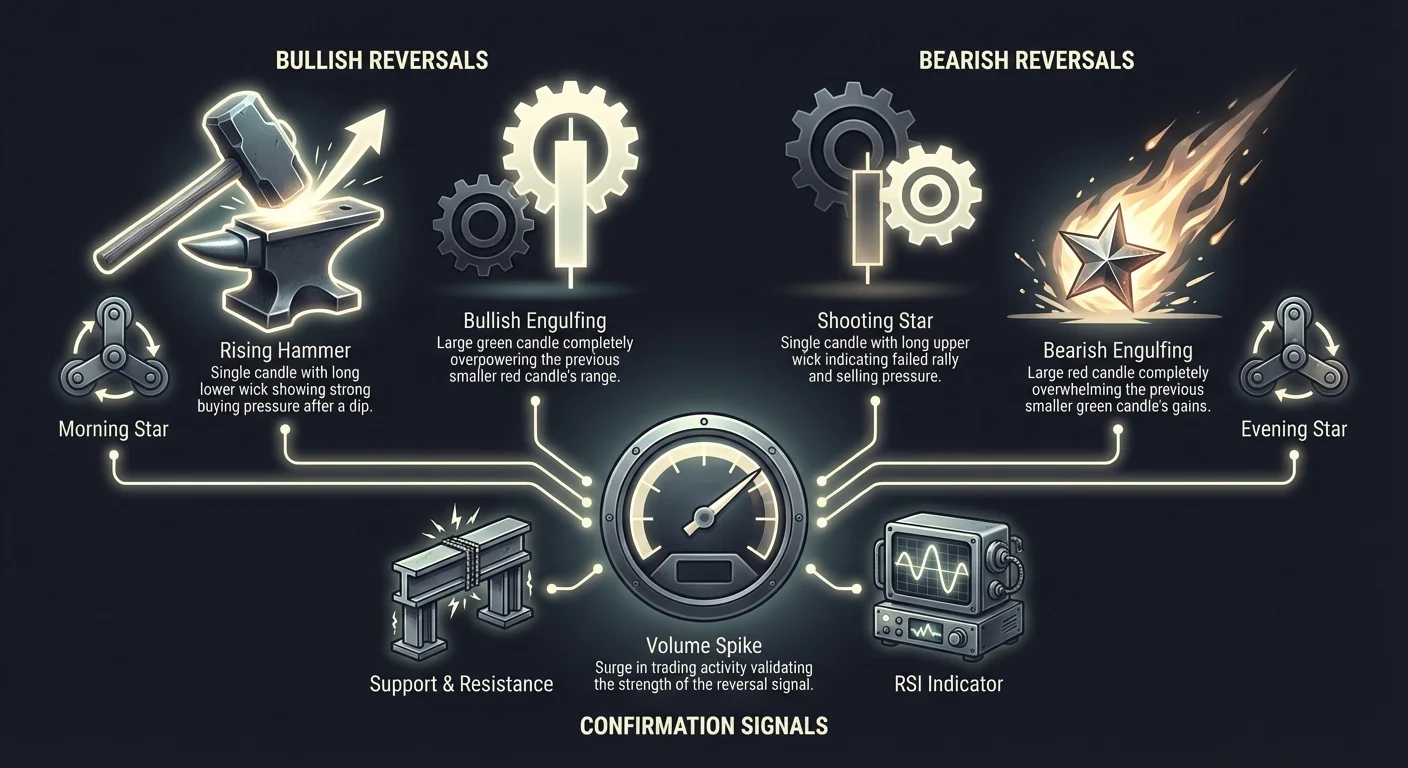
The Rising Hammer is a classic bullish reversal pattern that appears at the bottom of a downtrend. Its distinct shape resembles a hammer, consisting of a small real body near the top of the range and a long lower shadow. For a candle to qualify as a true hammer, the lower wick must be at least two to three times the size of the body. The upper shadow should be very short or nonexistent.
This pattern tells a story of initial bearish dominance followed by a strong recovery. As the period opened, sellers pushed the price down significantly, continuing the prevailing downtrend. However, at the session lows, buyers stepped in aggressively. They absorbed the selling pressure and drove the price back up, closing near the opening level.
While the body of the hammer can be red or green, a green closing provides a stronger bullish signal. It indicates that buyers not only recovered the losses but managed to push the price higher than the open. This shift in control suggests that the bearish momentum is fading and a potential bottom is forming. Traders often look for this pattern near known support zones to confirm that the floor is holding.
The Shooting Star Warning
The bearish counterpart to the hammer is the Shooting Star. This pattern forms after a strong uptrend and serves as a warning that bullish momentum may be exhausted. Visually, it is an inverted hammer. It features a small real body at the lower end of the trading range and a long upper wick that is at least twice the length of the body.
The psychology behind the Shooting Star is driven by a trap. During a rally, late buyers often rush in due to fear of missing out (FOMO), pushing prices to new highs. However, sellers take advantage of these higher prices to unload their positions. The subsequent selling pressure overwhelms the buyers, driving the price back down to close near the open.
This rejection of higher prices signals that the bulls are losing control. If the candle is red, meaning the close is lower than the open, the bearish signal is reinforced. It indicates that despite the intraday rally, the bears won the session. When this pattern appears near a resistance level, it suggests a high probability of a downside reversal or a significant correction.
Confirming Single-Candle Signals
While Hammers and Shooting Stars are powerful, they should not be traded in isolation. A single candle represents only one period of data. To reduce the risk of false signals, traders must look for confirmation in the subsequent price action. For a Rising Hammer, confirmation typically comes in the form of a bullish candle following the pattern. This next candle should close higher than the hammer, verifying that buyers have maintained control.
Similarly, a Shooting Star requires bearish confirmation. Traders look for the next candle to close lower or break below the low of the Shooting Star. This follow-through proves that the selling pressure observed in the wick was not a temporary anomaly. Without this confirmation, the pattern may simply be a pause in the trend rather than a reversal.
Volume is another critical confirmation tool. A Hammer or Shooting Star accompanied by a spike in trading volume indicates strong participation in the rejection. High volume suggests that many traders were involved in the battle, making the result more significant. Conversely, a pattern formed on low volume may lack the conviction needed to sustain a trend change.
| Pattern | Trend Context | Key Feature | Signal |
|---|---|---|---|
| Rising Hammer | Downtrend | Long lower wick | Bullish Reversal |
| Shooting Star | Uptrend | Long upper wick | Bearish Reversal |
Momentum Shifts and Engulfing Patterns
While single-candle patterns indicate potential rejection, two-candle patterns can signal a definitive shift in momentum. Engulfing patterns are among the most popular visual cues for traders because they show a complete overpower of one side by the other. These formations involve two adjacent candles of opposite colors, where the second candle completely covers the body of the first.
The size relationship between the two candles is the defining characteristic. The first candle is typically small, representing a pause or weakening of the current trend. The second candle is large and moves aggressively in the opposite direction. This drastic change in range and direction highlights a sudden surge in volume and conviction.
The Bullish Engulfing Setup
A Bullish Engulfing pattern typically marks the end of a downtrend. The first candle in the formation is red, reflecting the ongoing selling pressure. However, the body of this candle is often small, suggesting that sellers are running out of steam. The second candle opens lower than the previous close—often gapping down in traditional markets—but then rallies sharply.
The key criteria is that the body of the green candle must completely engulf the body of the red candle. It opens below the red candle's close and closes above the red candle's open. In the 24/7 crypto markets, true gaps are rare, so the focus is primarily on the second body wrapping around the first.
This pattern represents a decisive victory for the bulls. The initial dip was met with overwhelming demand, wiping out the losses of the previous period and pushing prices higher. When this occurs at a support level or after a panic sell-off, it provides a strong signal to enter a long position. It suggests that market sentiment has flipped from fear to greed in a single session.
The Bearish Engulfing Setup
The Bearish Engulfing pattern is the exact opposite and forms during an uptrend. It begins with a small green candle, indicating that the upward trend is still intact but perhaps slowing down. The next candle is a large red one that opens above the previous close and closes below the previous open.
This formation signals that sellers have taken control with force. The bulls attempted to push the price higher, but the bears stepped in and drove the market down, erasing all gains from the previous period. The visual of a large red block swallowing a smaller green one is a clear indication of a change in dominance.
The Bearish Engulfing pattern is particularly potent when it appears at a major resistance level or when the market is overbought. It suggests that the rally has hit a ceiling and that profit-taking or short-selling is accelerating. Traders often use this signal to exit long positions or initiate short trades, anticipating a deeper pullback.
Analyzing Pattern Strength
Not all engulfing patterns carry the same weight. Several factors can increase the reliability of the signal. First, the relative size of the candles matters. A pattern where the second candle is significantly larger than the first—for example, 1.5 times the size—indicates stronger momentum. A massive second candle shows that the reversal was driven by high conviction.
Second, the context of the trend is vital. An engulfing pattern that appears after a prolonged and steep trend is more significant than one that forms in a choppy, sideways market. If the market is moving sideways, an engulfing candle may just be random noise.
Finally, volume plays a crucial role here as well. If the second, engulfing candle is accompanied by a surge in trading volume, it confirms that new money is entering the market to drive the reversal. This high volume validates the price action, suggesting that the trend change is supported by institutional or aggregate market interest.
Three-Candle Reversal Structures
Moving beyond single and double candle formations, three-candle patterns offer a more detailed narrative of trend reversal. These structures unfold over three distinct sessions, providing a beginning, a middle, and an end to the transition. The Morning Star and Evening Star are the primary examples of these complex patterns.
These patterns are highly valued because they include a specific period of "indecision." This middle phase acts as a buffer between the old trend and the new one. It signals that the momentum of the prevailing trend has stalled, clearing the way for a reversal.
The Morning Star Sequence
The Morning Star is a bullish reversal pattern that signals the end of a downtrend. It consists of three specific candles. The first is a long red candle that continues the existing downward movement. This confirms that bears are still in control during the first session.
The second candle is the "star." It is a small-bodied candle that can be red, green, or a doji (where open and close are virtually equal). The key feature of this middle candle is its small size, which indicates indecision. The aggressive selling pressure from the first candle has evaporated, but buyers have not yet taken over. The market is in a state of equilibrium.
The third candle delivers the confirmation. It is a strong green candle that closes well into the body of the first red candle—ideally above the midpoint. This confirms that the indecision has resolved in favor of the bulls. The pattern creates a U-shape on the chart, visually representing the rounding bottom of the price action.
The Evening Star Sequence
The Evening Star is the bearish mirror image, appearing at the top of an uptrend. The first candle is a long green one, showing that bulls are driving the price higher. The trend is clearly up at this stage.
The second candle is the small-bodied star. It indicates that the upward momentum has stalled. Buyers are no longer pushing the price significantly higher, and the market is hesitating. This hesitation is often a precursor to a trend change.
The third candle is a large red one that closes deep into the body of the first green candle. This confirms that sellers have seized control following the period of indecision. The structure looks like an inverted U-shape. Traders view this as a reliable signal to take profits or consider short entries, especially if the pattern forms near a historical high.
Trading the Indecision
The power of the Morning and Evening Star patterns lies in the middle candle. This period of indecision allows traders to prepare for a potential move without committing prematurely. The small body of the star acts as a pivot point.
Risk management strategies often utilize this pivot. For a Morning Star, traders might place a stop-loss just below the low of the middle candle. Since this level represents the absolute bottom of the indecision period, a break below it would invalidate the reversal thesis.
Similarly, for an Evening Star, the stop-loss is typically placed just above the high of the middle candle. If the price breaks above this level, it means the uptrend is continuing and the reversal signal has failed. By using the structure of the pattern itself to define risk, traders can set clear parameters for their positions.
Strategic Context and Confirmation
While candlestick patterns provide excellent entry signals, they are not crystal balls. A pattern that looks perfect in isolation can fail if the broader market context is ignored. To increase the success rate of trades based on these signals, traders must integrate other forms of technical analysis.
Context filters out bad signals. A bullish pattern in a strong bear market might just be a small relief rally before lower lows. Conversely, a bearish pattern in a raging bull market might be a brief pause. Understanding where the pattern forms is just as important as the pattern itself.
Support and Resistance Integration
The most effective place to look for candlestick reversals is at key support and resistance levels. Support zones are price levels where buying interest has historically been strong enough to overcome selling pressure. If a Rising Hammer or Bullish Engulfing pattern forms right at a support line, the signal is reinforced. The technical level provides the "why" for the reversal, while the candle provides the "when."
Resistance levels act as ceilings where selling pressure increases. A Shooting Star or Evening Star that forms precisely at a known resistance level is a high-probability setup. The confluence of a structural barrier and a price action signal creates a compelling case for a trade.
If a pattern forms in the middle of a trading range, far from any significant support or resistance, it carries much less weight. These "floating" signals are often traps or random noise. Traders should exercise patience and wait for price action to interact with key levels before acting.
Using Technical Indicators
Technical indicators can serve as a second opinion for candlestick signals. Oscillators like the Relative Strength Index (RSI) are particularly useful. The RSI measures the speed and change of price movements to identify overbought or oversold conditions.
If a Bullish Engulfing pattern appears when the RSI is below 30 (oversold), it suggests that the selling pressure is mathematically exhausted, adding weight to the bullish reversal. Conversely, if a Bearish Engulfing or Shooting Star forms when the RSI is above 70 (overbought), it confirms that the price may be overextended and due for a correction. Utilizing an entire momentum confirmation stack provides superior trade confidence.
The Moving Average Convergence Divergence (MACD) is another valuable tool. Traders can look for MACD crossovers or divergences that align with the candlestick pattern. For instance, if a Morning Star forms while the MACD lines are crossing upward, the two signals corroborate each other, increasing confidence in the trade.
| Indicator | Function | Confirmation Signal |
|---|---|---|
| RSI | Momentum | Overbought/Oversold zones |
| MACD | Trend direction | Crossovers |
| Volume | Participation | Spikes on reversal candle |
Volume Analysis
Volume acts as the fuel for price movement. A reversal pattern that occurs on low volume is suspect. It implies that the main market participants are not driving the move. For a valid reversal, there should be a noticeable increase in trading activity.
In a Bullish Engulfing pattern, traders want to see high volume on the green engulfing candle. This shows that buyers are aggressively entering the market. In a Shooting Star, a spike in volume indicates that the rejection of higher prices was met with heavy selling orders.
Volume analysis is particularly important in crypto markets, which can be susceptible to manipulation or low liquidity on smaller timeframes. A high-volume candle confirms that a significant exchange of assets took place, establishing a more solid foundation for the new trend.
Risk Management Essentials
No matter how strong a signal appears, trading involves probability, not certainty. Candlestick patterns can and do fail. Therefore, rigid risk management is essential when trading these setups.
Every trade entry based on a candlestick pattern should have a predefined exit point if the market moves against the trader. As mentioned with Star patterns, the highs or lows of the formation often serve as logical position size and stop-loss levels.
For a Bullish Hammer, a stop-loss is commonly placed just below the bottom of the lower wick. If sellers manage to push the price below the wick, the bullish rejection has been invalidated. For a Bearish Engulfing pattern, the stop-loss goes above the highest point of the two-candle formation.
Traders must also consider their risk-reward ratio. The potential profit from the trade should be significantly larger than the risk defined by the stop-loss. By combining precise entry signals from candlesticks with disciplined risk controls, traders can navigate the volatile crypto markets more effectively.
Conclusion
Candlestick patterns serve as a vital language for interpreting the complex dynamics of cryptocurrency markets. From the single-candle rejection of the Hammer and Shooting Star to the two-candle momentum shifts of Engulfing patterns, these formations provide immediate insight into the battle between buyers and sellers. The three-candle Morning and Evening Star patterns offer even greater detail, highlighting the transitional phase of market indecision before a trend reverses.
However, the true power of these signals is unlocked only when they are used in the proper context. A pattern is not a guarantee of future price action but a probability marker. Integrating these signals with support and resistance analysis, volume confirmation, and momentum indicators like RSI and MACD transforms simple observations into robust trading strategies. This holistic approach helps traders filter out noise and focus on high-conviction setups.
Ultimately, successful trading relies on discipline and risk management. By defining stop-losses based on the structure of these patterns and waiting for confirmation before entering, traders can protect their capital while positioning themselves to capture market trends. Understanding the psychology behind each candle allows for smarter, more confident decision-making in the fast-paced world of crypto.
Mastering candlestick patterns requires patience, context, and the discipline to wait for confirmation before acting.