
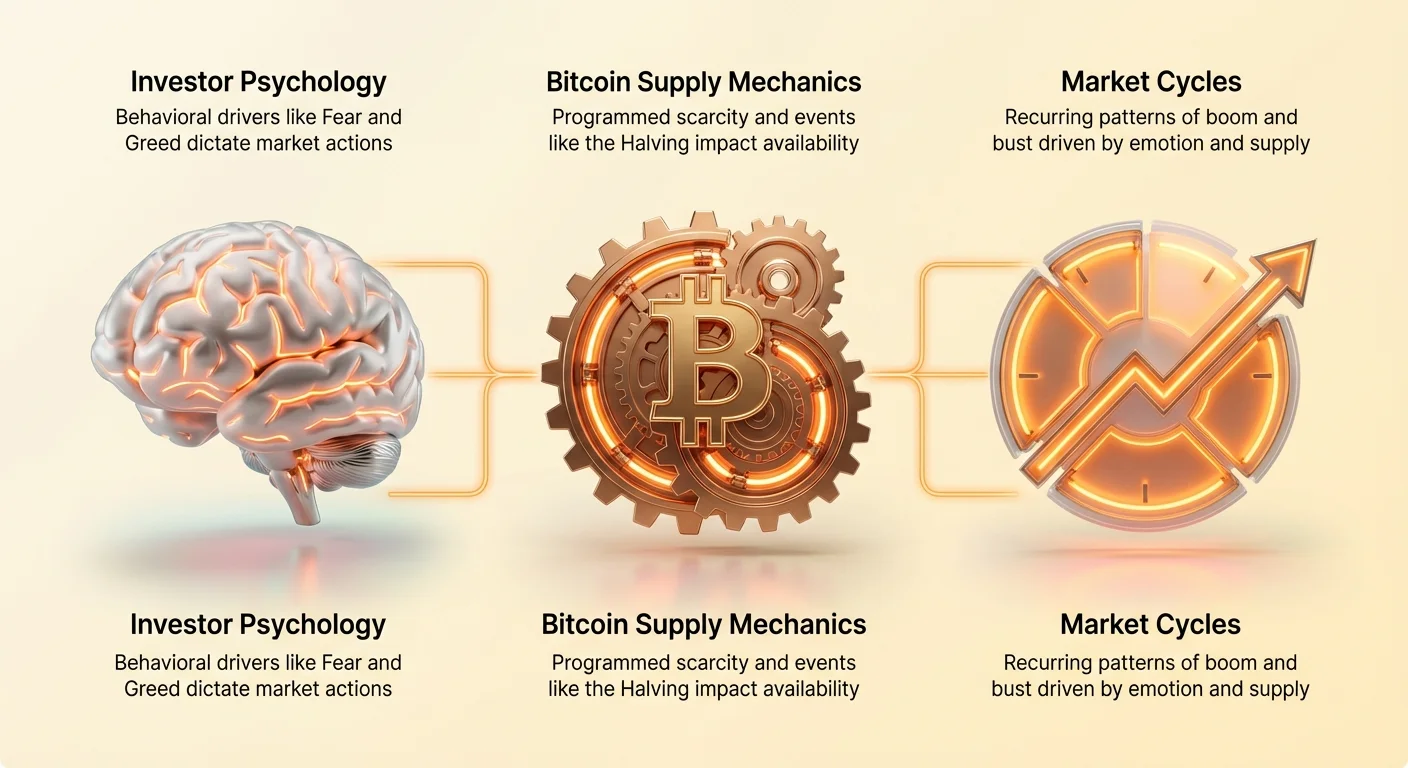
For newcomers approaching the digital asset space, Bitcoin’s price history can appear erratic—a series of unpredictable spikes and dramatic crashes. However, when we apply a structured analytical lens, patterns emerge. These recurring patterns, known as market cycles, are not random; they are driven by the foundational supply mechanics of Bitcoin and, more critically, by the collective behavior and psychology of market participants.
Understanding these market cycles is essential for anyone seeking to build a sound investment thesis, moving beyond simply tracking the daily price movements. Instead of seeing volatility as chaos, we learn to recognize it as a predictable consequence of human emotion transitioning between extreme fear and irrational exuberance.
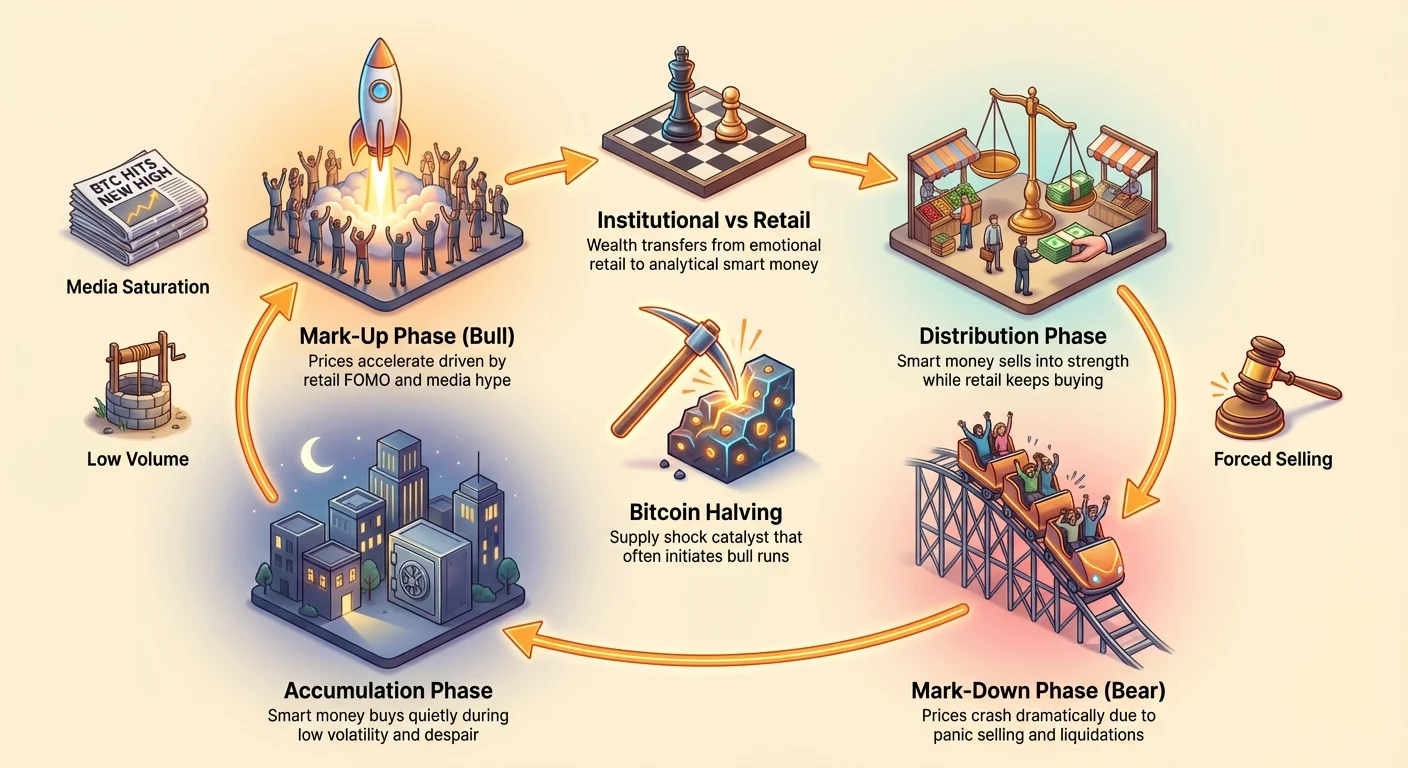
This analysis adopts the perspective of a financial analyst, breaking down the Bitcoin market into four distinct phases. By identifying the psychological, technical, and macroeconomic hallmarks of each phase—Accumulation, Mark-Up, Distribution, and Mark-Down—investors can develop robust strategies designed to capture long-term value and minimize exposure to emotional decision-making.
The Core Mechanism: Cycles Driven by Human Psychology
Traditional finance often focuses purely on fundamentals (earnings, debt ratios). In the nascent and highly volatile crypto market, technical supply mechanics intersect with powerful human emotions to create these dramatic boom-and-bust cycles. Bitcoin’s volatility is not a flaw, but a feature of its growth trajectory and its status as a scarce asset being adopted globally.
The market cycle framework we use here is derived from behavioral economics, suggesting that price movement is primarily a mirror reflecting the prevailing sentiment of investors.
The Behavioral Component: Fear, Greed, and the Cycle of Emotion
Every market cycle can be mapped directly onto the investor psychology curve. This curve demonstrates how price movement escalates human emotional responses, which in turn fuels the next price movement:
- Hope/Optimism: Prices are stabilizing after a crash; early investors begin to feel relief.
- Thrill/Euphoria: Prices accelerate dramatically; media coverage spikes; everyone believes they are a genius. This is the peak of Greed.
- Anxiety/Denial: Prices stop rising and begin to dip; investors refuse to sell, expecting the trend to continue.
- Capitulation/Despair: Prices crash; investors sell at any cost to stop the pain. This is the peak of Fear.
Recognizing where the market currently sits on this emotional spectrum is the fundamental challenge of bitcoin market cycle analysis. Investors who buy in the despair phase and sell into the euphoria phase often succeed; retail investors often do the opposite.
The Role of Volatility in Price Discovery
Bitcoin exhibits volatility significantly higher than traditional assets like gold or stocks. This extreme movement serves a crucial function: price discovery. Because Bitcoin has no underlying corporate cash flows or tangible physical assets to model its worth, its price is constantly searching for equilibrium based on adoption rates, macroeconomic risk, and network security.
High volatility during bull phases (Mark-Up) signals rapid adoption and massive capital inflow, while high volatility during bear phases (Mark-Down) signals systemic risk aversion and mass liquidation. The cycles are simply the rhythmic process of the market correcting between these two extremes.
Phase 1: Accumulation (The Hope Phase)
The Accumulation phase marks the beginning of a new cycle and immediately follows the devastating "Capitulation" event of the previous cycle. This period is typically long, boring, and emotionally taxing for those who lived through the preceding crash.
The accumulation zone is defined by consolidation. Price action is flat, liquidity is low, and major institutional players and "smart money" (experienced investors and funds) quietly begin purchasing assets they believe are oversold.
Identifying the Accumulation Zone Indicators
Identifying the true accumulation zone is key to maximizing returns, as this is where asset risk is theoretically lowest relative to potential reward.
The primary indicators of the accumulation zone include:
- Low Volatility and Volume: After the chaos of the crash, daily price swings shrink dramatically. Trading volume often dries up, showing little retail interest.
- Time Duration: Accumulation often lasts 12 to 18 months, representing the market’s need to fully absorb the supply dumped during the preceding crash.
- Advanced On-Chain Metrics: Professional analysts often look for specific on-chain signals that indicate long-term holders are entering the market while short-term speculators have left. For example, when the Spent Output Profit Ratio (SOPR) is consistently below 1, it implies that most people selling are doing so at a loss, a hallmark of the final emotional exhaustion required before a cycle reverses. (For a deeper dive into these tools, see: On-Chain vs. Macro Valuation Models: Tools for Determining BTC Fair Value).
Best Practices for the Patient Accumulator
For investors targeting this phase, patience is the ultimate virtue. This phase tests conviction, as negative news headlines (FUD – Fear, Uncertainty, and Doubt) often proliferate, reinforcing the idea that the asset is "dead."
- Dollar-Cost Averaging (DCA): Because the exact bottom of the accumulation zone is impossible to pinpoint, consistently buying fixed dollar amounts over an extended period smooths out the entry price and negates the need for perfect timing.
- Establish a Base Thesis: Revisit why you believe in Bitcoin’s long-term value. Focus on network growth, hash rate security, and scarcity rather than daily price fluctuations.
- Prepare for Boredom: The accumulation phase lacks the excitement of the bull market. Use this quiet time for education and strategy refinement.
Phase 2: Mark-Up (The Greed Phase / Bull Market)
The Mark-Up phase is the most celebrated period of the cycle, commonly referred to as the Bull Market. It begins when the price breaks out of the accumulation range, usually triggered by a significant macroeconomic shift or a supply-side shock.
During Mark-Up, confidence returns. The price rises slowly at first, convincing skeptical investors, then accelerating into a parabolic ascent driven by retail and media excitement.
The Cyclical Relationship with the Halving
The primary structural catalyst historically associated with initiating the Mark-Up phase is the Bitcoin Halving. Approximately every four years, the reward miners receive for validating transactions is cut in half.
This event directly impacts the available supply of new Bitcoin entering the market, creating a structural supply shock against a backdrop of increasing demand. Historically, the most intense Mark-Up (bull market) phases begin roughly 12–18 months after a halving event, once the supply squeeze has fully materialized.
This relationship demonstrates how structural economics influence market behavior, moving prices from the flat Accumulation phase into the explosive Mark-Up. (For detailed analysis, see: Supply Shock Economics: Analyzing the Bitcoin Halving Cycle and Pre/Post-Event Pricing).
Warning Signs During Exponential Growth
While the Mark-Up phase is profitable, it harbors the greatest risk for new investors who suffer from FOMO (Fear of Missing Out). As the Mark-Up accelerates, price increases become exponential, signaling that the move is unsustainable.
Key behavioral and technical indicators that the Mark-Up is maturing include:
- Retail FOMO: New, highly leveraged capital (retail investors) enters the market, often buying assets without understanding the underlying technology or risk.
- Media Saturation: Bitcoin becomes front-page news; celebrity endorsements and mainstream finance coverage treat the asset as a guaranteed win.
- "Top Signal" Memes: When price targets become highly aggressive, such as calling for 10x returns in a matter of weeks, it signals irrational euphoria.
- Exchange Liquidity: Institutions and experienced traders often look at the supply of Bitcoin held on centralized exchanges. If this supply drastically decreases during a bull run, it suggests investors are moving their crypto into self-custody for the long term. Conversely, if supply increases rapidly, it indicates potential sellers preparing to distribute.
Phase 3 & 4: Distribution and Mark-Down (The Fear Phases)
The Mark-Up cannot last forever. Once momentum fades, the cycle shifts into the most dangerous periods for investors: Distribution and the ensuing Mark-Down.
Identifying Market Tops (Distribution)
Distribution is the subtle, often lengthy process where smart money (institutional funds and long-term holders) strategically sells their accumulated assets to the new retail buyers pouring in during peak euphoria. This phase is characterized by extreme volatility but little net upward movement.
Market top indicators during the Distribution phase include:
- Divergence in Volume and Price: The price hits a new high, but the volume supporting that move is significantly lower than previous highs. This suggests that fewer people are willing to buy at that price point.
- Long Consolidation with Weak Highs: The asset trades in a choppy range, unable to break significantly higher. The early sellers are able to offload large positions without crashing the price because retail buyers are soaking up the supply.
- Institutional Selling into Strength: Major corporate treasury movements or institutional ETF outflows may signal professional actors are taking profits.
Once the initial distribution is complete and buyers are exhausted, the price inevitably begins its descent.
The Capitulation Event (Mark-Down)
The Mark-Down is the official Bear Market phase, representing the full psychological shift from greed to panic. Prices decline steadily at first, moving through periods of denial ("It’s just a healthy correction") and finally into the devastating Capitulation.
Capitulation is the point of maximum pain, defined by sharp, severe drops in price driven by forced selling and margin calls.
- Forced Selling: Highly leveraged traders who borrowed money to buy during the Mark-Up are liquidated (forced to sell their assets by the exchange). This creates massive cascade effects, driving the price down rapidly.
- Media Panic: Financial media shift from hyping the asset to predicting its demise. This sensationalism further fuels the retail exodus.
- Duration: Mark-down phases can be swift (a few months of intense selling) but often lead directly into the slow, grueling 12–18 month period of re-accumulation.
Retail vs. Institutional Behavioral Patterns
Understanding btc bull vs bear phases is impossible without distinguishing the behavior of different market actors:
| Actor Type | Primary Action During Bull (Mark-Up) | Primary Action During Bear (Mark-Down) |
|---|---|---|
| Retail Investor | Buys aggressively during high volatility (FOMO), often using leverage. | Sells aggressively during crashes (Capitulation), locking in losses. |
| Institutional/Smart Money | Sells strategically into retail strength (Distribution). | Buys strategically during low volatility (Accumulation). |
| Long-Term Holders | Holds through the cycle, sometimes selling a fraction near the peak, but primarily focuses on network security. | Holds through the bear market, often increasing positions. |
The market cycle effectively transfers wealth from the psychologically driven retail investors (who follow emotion) to the analytically driven smart money (who follow the cycle framework).
Applying the Framework: Strategies for Different Phases
The market cycle analysis is not merely academic; it is a critical tool for developing practical, risk-managed investment strategies. By aligning your actions with the prevailing phase, you significantly improve your probabilities of success.
The Importance of Long-Term Time Horizon
The most powerful lesson derived from cyclical analysis is the necessity of a long-term time horizon. Bitcoin has consistently demonstrated that the previous cycle's peak eventually becomes the floor (or support level) for the next cycle.
Because Bitcoin is often cited for its potential as a store of value—an asset expected to maintain or increase its purchasing power over long periods—investors must be prepared to weather multi-year drawdowns. The Mark-Down and Accumulation phases are necessary resets that shed weak hands and prepare the foundation for the next explosive Mark-Up.
Tactical Strategy Matrix
| Phase | Investor Sentiment | Recommended Action | Risk Posture |
|---|---|---|---|
| Accumulation | Despair, Boredom | Systematic DCA purchases. Establish core position. | High reward/Low perceived risk |
| Mark-Up (Early) | Hope, Optimism | Hold core position. Monitor valuation models. | Moderate risk |
| Mark-Up (Late/Euphoria) | Greed, Thrill | Reduce risk. Take partial profits or set stop-losses. | Extreme risk |
| Distribution | Anxiety, Denial | Stop buying. Focus on capital protection. | High risk |
| Mark-Down | Fear, Capitulation | Avoid emotional selling. Prepare cash for Accumulation phase. | Extreme risk/Short-term pain |
This framework serves as a disciplined counterpoint to the emotional swings of the crypto market. It replaces reactive FOMO and panic selling with proactive, calculated decisions based on structural and psychological analysis.
Conclusion
Bitcoin market cycles are a fundamental feature of the asset’s price history, reflecting the unique blend of its programmed scarcity (the Halving) and the universal patterns of investor psychology (fear and greed). By adopting the four-phase model—Accumulation, Mark-Up, Distribution, and Mark-Down—investors can move past simple price charting and integrate a powerful behavioral economic framework into their analysis.
The ultimate goal of bitcoin market cycle analysis is not to predict the exact price, but to identify where we are in the emotional journey. Self-sovereignty in the digital economy begins with self-control, and mastering the cyclical nature of volatility is the first step toward becoming a truly disciplined investor.