
Cryptocurrency trading relies heavily on the ability to interpret visual data quickly and accurately. Price charts are not merely lines and bars on a screen. They represent the collective psychology of millions of market participants. Every tick upwards represents buying pressure, while every movement down signifies selling intent. Among the various tools available to traders, candlestick patterns remain one of the most popular methods for gauging market sentiment.
However, a pattern in isolation is often meaningless. A green candle in a sideways market means something very different from the same candle appearing after a significant crash. To trade effectively, one must apply a reliability framework that grades these patterns based on their specific market context. This approach moves beyond simple pattern recognition and into the realm of strategic analysis. By understanding the specific criteria, psychological underpinnings, and confirmation requirements for key patterns, traders can better navigate the volatile crypto landscape.
The Foundation of Contextual Analysis
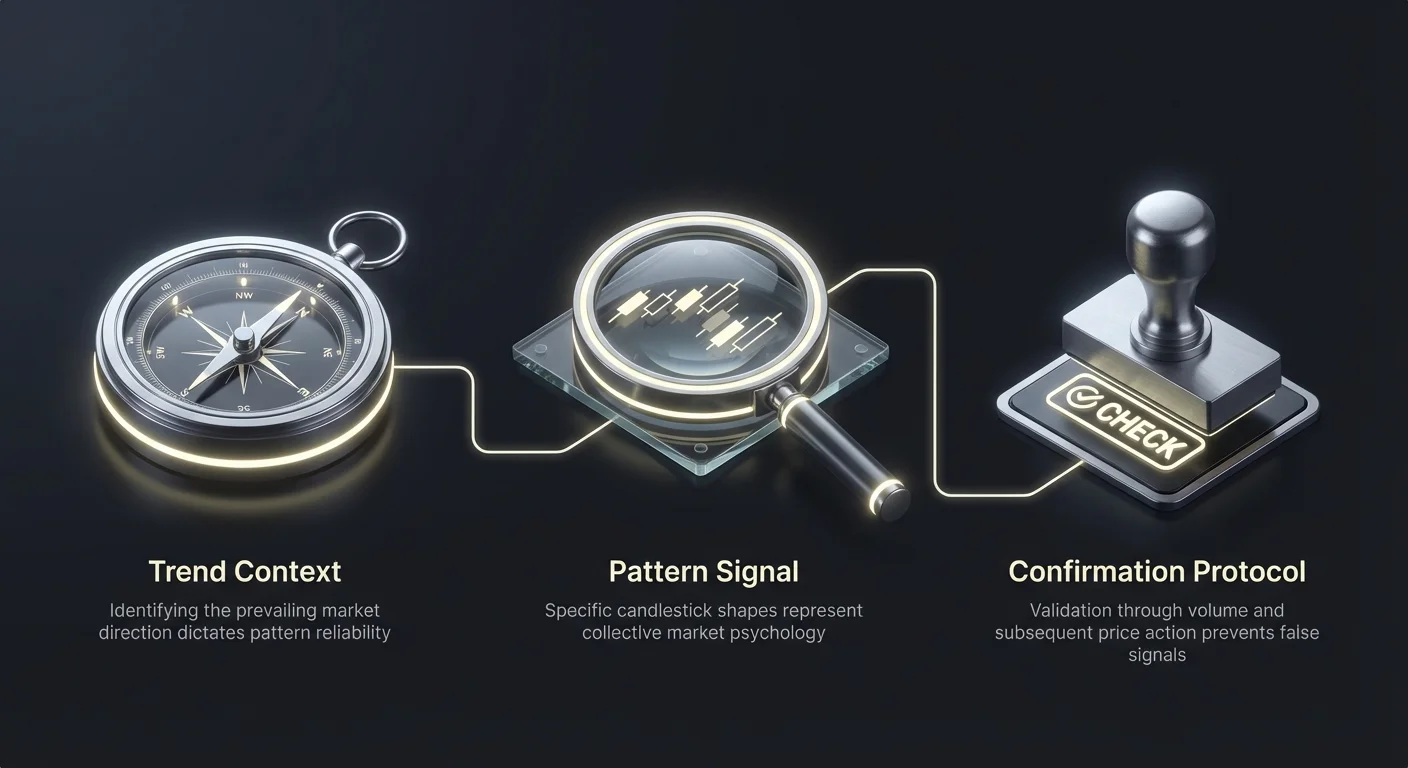
Successful technical analysis starts with the understanding that context dictates reliability. A powerful reversal signal is only valid if there is an established trend to reverse. Identifying the prevailing market direction is the first step in the reliability framework. Without a clear uptrend or downtrend, reversal patterns often generate false signals.
Establishing the Preconditions
The primary rule for any reversal pattern is the existence of a prior trend. A bullish reversal pattern, such as a hammer or morning star, essentially signals that a downward trajectory is hitting a floor. If the market is moving sideways or chopping in a tight range, the appearance of these candles is often just noise.
Traders must verify that the asset has undergone a sustained period of selling before looking for bullish signs. Conversely, bearish patterns require a clear uptrend. A shooting star or evening star essentially warns that the ceiling is near. If prices haven't been rising, there is no momentum for sellers to arrest. The stronger and more prolonged the preceding trend, the more significant the potential reversal signal becomes.
The Role of Support and Resistance
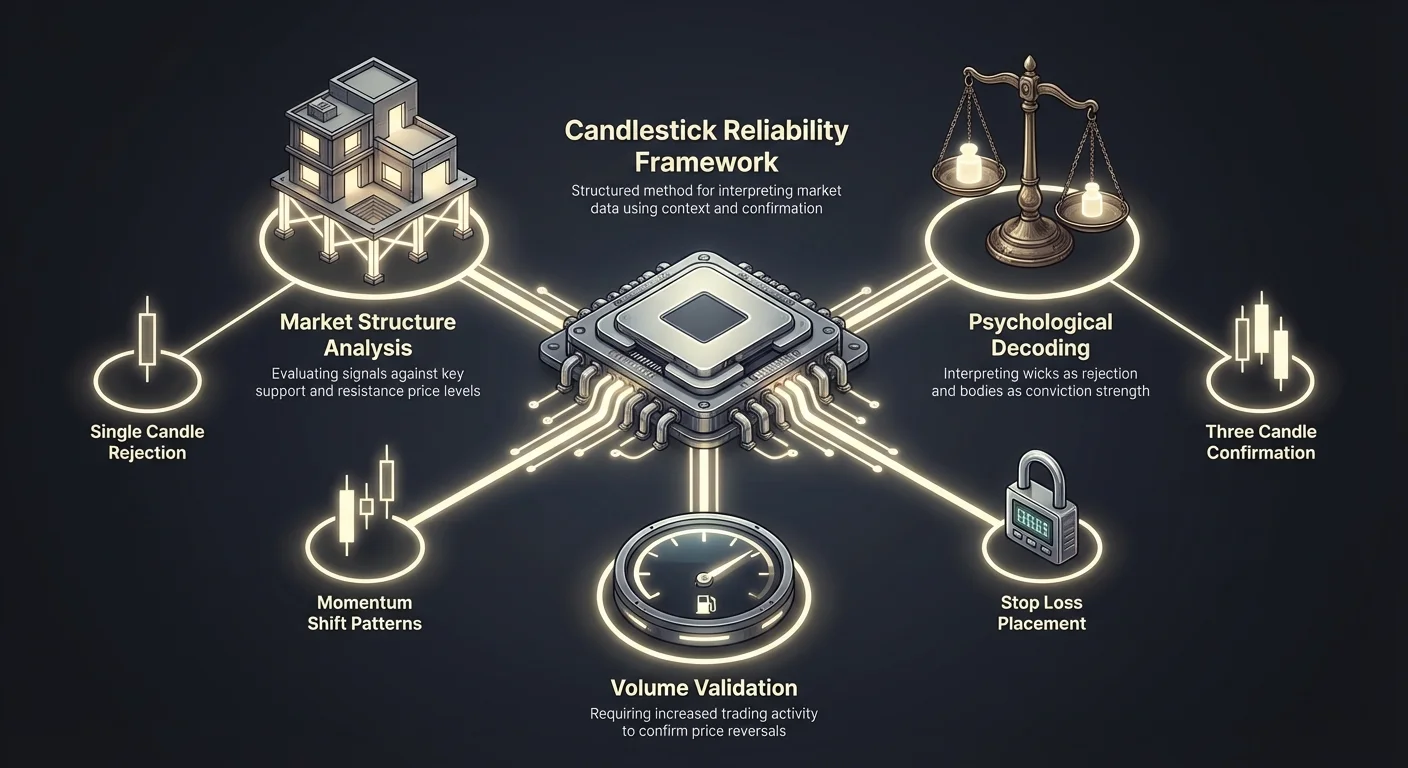
The reliability of any candlestick formation increases significantly when it aligns with key market structures. Support zones are price levels where buying interest has historically been strong enough to overcome selling pressure. Resistance zones are levels where selling interest has historically halted price increases.
When a bullish pattern forms directly on a major support line, the signal is amplified. It suggests that the technical floor is holding and buyers are stepping in exactly where expected. Similarly, a bearish pattern at a known resistance level confirms that the overhead supply of coins is still present. This confluence of pattern and location is a core component of grading a setup's quality. A pattern floating in the middle of a trading range carries a much lower reliability grade than one interacting with historical price barriers.
Single-Candle Rejection Signals
Single-candle patterns are the most basic building blocks of technical analysis. They offer immediate feedback on intraday battles between bulls and bears. While they are simple to spot, they require strict adherence to identification formulas to avoid confusion with standard market noise.
The Rising Hammer
The rising hammer is a quintessential bullish reversal signal. It tells a dramatic story of intraday recovery. The session begins with sellers driving the price down, continuing the prevailing downtrend. However, at some point during the period, buyers find value and aggressively step in. They absorb the selling pressure and push the price back up, closing near the opening level.
To grade a hammer as high-quality, specific criteria must be met. The lower shadow, or wick, must be at least two to three times the length of the body. This long wick visually represents the failed attempt by sellers to push the market lower. The real body should be small and situated at the top of the candle. While a green body is preferred because it shows bulls actually won the session, a red body is acceptable if the wick is sufficiently long. The upper shadow should be virtually nonexistent, indicating that once buyers took control, they held it until the close.
The Shooting Star
The shooting star acts as the bearish mirror to the hammer. It appears after an uptrend and warns that buyers are losing their grip on the market. The psychological narrative here involves a "bull trap." The session opens, and buyers immediately push prices to new highs, driven by momentum or FOMO (fear of missing out).
However, sellers utilize these higher prices to offload their holdings. This selling pressure overwhelms the buyers, driving the price back down to close near the open. The result is a candle with a small body at the bottom and a long upper wick. For a reliable signal, this upper wick must be at least two to three times the size of the body. The long wick serves as a monument to the failed rally. It shows that higher prices were rejected by the market. Just like the hammer, the color of the body is secondary to the structure, though a red body indicates a stronger bearish close.
Two-Candle Momentum Shifts
While single candles show rejection, two-candle patterns show a complete transfer of control. These patterns are often considered more reliable because they involve a confirmable shift in momentum over two distinct periods. The "Engulfing" family of patterns represents this decisive change in market leadership.
Bullish Engulfing Mechanics
The bullish engulfing pattern is a loud signal that buyers have overpowered sellers. It occurs after a downtrend and consists of two specific candles. The first is a red candle, consistent with the ongoing bearish trend. It reflects that sellers were still in control during that period.
The second candle changes the narrative entirely. It is a large green candle that opens lower than the previous close but rallies significantly. Crucially, the body of this green candle must completely cover, or "engulf," the body of the previous red candle. This structure shows that all selling pressure from the previous period has been erased and surpassed by new buying volume. The visual dominance of the green candle over the red one marks a psychological turning point. It suggests that the bottom has likely been reached and a new upward trajectory may be forming.
Bearish Engulfing Dynamics
On the opposite end of the spectrum lies the bearish engulfing pattern. This formation appears at the peak of an uptrend and signals that the bulls have run out of steam. The first candle is green, indicating that the upward trend was still active. However, the second candle is a large red one that completely engulfs the body of the first green candle.
The psychology here is brutal for late buyers. The market may have opened higher, enticing traders to enter long positions. However, heavy selling immediately takes over, driving the price down below the previous period's open. This rapid shift traps bulls who bought the top and triggers stop-losses, which fuels further downside momentum. The larger the red candle relative to the green one, the stronger the bearish signal. If the red candle engulfs multiple preceding green candles, the signal is considered even more reliable.
Three-Candle Confirmation Structures
Moving further up the reliability scale, we encounter three-candle patterns. These formations are highly valued because they unfold over a longer timeframe, providing a more detailed picture of the reversal process. They typically consist of a trend candle, a moment of indecision, and a confirmation candle.
The Morning Star
The Morning Star is a bottoming pattern that resembles a "U" shape on the chart. It signals a gradual but decisive transition from bearish to bullish control. The first component is a long red candle, which confirms that bears are initially in charge and driving prices lower.
The second candle is the pivot point. It is a small-bodied candle, often referred to as a "star" or a "doji." This candle indicates indecision. The selling pressure has subsided, but buyers haven't fully taken over yet. The market is effectively pausing to catch its breath. The third candle delivers the resolution. It is a strong green candle that closes well into the body of the first red candle, ideally above the midpoint. This third candle confirms that the indecision has resolved in favor of the bulls. It validates the reversal and provides a clear signal to traders watching for a bottom.
The Evening Star
The Evening Star is the bearish equivalent, marking the top of a trend with an inverted "U" shape. It begins with a long green candle, showing that the uptrend is healthy and buyers are aggressive. This is followed by the small "star" candle, indicating that the upward momentum has stalled.
The appearance of this small middle candle is the first warning sign. It shows that despite the previous momentum, buyers could not push the price significantly higher. The third candle acts as the executioner of the trend. It is a long red candle that plunges down, closing below the midpoint of the first green candle. This confirms that sellers have seized control and that the previous uptrend has likely terminated. Traders often use the high of the middle "star" candle as a definitive resistance level for placing stop-losses.
The Psychology of Market Control
Understanding the psychology behind these patterns is more valuable than memorizing their shapes. Every candlestick tells a story of a battle between two opposing forces. The reliability framework depends on interpreting who won the battle and how decisively they won it.
Wick Analysis
The "wicks" or "shadows" of a candle are arguably the most important element in reading market psychology. A long wick represents a rejection of price. In a hammer, the long lower wick shows that sellers pushed price down, but buyers viewed that price as too cheap and bought it back up.
Conversely, a long upper wick, as seen in a Shooting Star, shows that buyers pushed price up, but sellers viewed it as too expensive and sold it back down. The length of the wick relative to the body is a direct measure of the rejection's strength. A short wick suggests mild resistance, while a massive wick suggests a violent rejection. Traders should look for wicks that are outliers compared to recent price action. These anomalies often mark significant turning points where value perception shifted instantly.
Body Analysis
The "real body" of the candle represents the ultimate outcome of the period's battle. It is the distance between the open and the close. A large body indicates strong conviction. If a candle opens and closes near opposite extremes, it means one side dominated the entire session.
Small bodies, like those found in the middle of Morning and Evening Stars, represent equilibrium. Neither buyers nor sellers could make significant progress. This equilibrium is often the calm before the storm. A transition from large bodies (trend) to small bodies (indecision) and back to large bodies (reversal) is the standard rhythm of a market turning point. Recognizing this rhythm helps traders anticipate changes before they become obvious trends.
The Confirmation Checklist
Even the most perfect-looking pattern can fail. In the volatile world of cryptocurrency, false signals are common, especially during periods of low liquidity. To improve the reliability grade of any trade setup, traders must look for confluence from other technical factors.
Volume Validation
Volume is the fuel that drives market moves. A reversal pattern that forms on low volume is suspect. It suggests that the price reversal was caused by a lack of interest rather than a surge of counter-momentum. For a high-reliability grade, a reversal candle should be accompanied by a spike in trading volume.
For example, in a Bullish Engulfing pattern, the second (green) candle should ideally show higher volume than the first (red) candle. This confirms that new money is entering the market to support the price increase. Similarly, a Shooting Star with high volume indicates that a massive amount of selling occurred at the top, creating a formidable resistance level. If volume is declining while a pattern forms, traders should be wary of a potential trap.
Next-Candle Confirmation
Patience is a virtue in technical analysis. One of the safest ways to trade these patterns is to wait for the "confirmation candle." This is the candle that immediately follows the pattern. For a bullish hammer, the confirmation would be a green candle that closes higher than the hammer's close.
This additional step reduces the risk of catching a falling knife. If a hammer forms but the next candle is a large red one that breaks the hammer's low, the signal has failed. The reversal did not hold. Waiting for confirmation means entering the trade slightly later and perhaps at a worse price, but it drastically increases the win rate by filtering out failed setups. In crypto markets, where fake-outs are common, this confirmation step is often the difference between a profit and a loss.
Risk Management within the Framework
No framework guarantees a 100% success rate. Therefore, defining risk is just as important as identifying the entry. Candlestick patterns provide natural levels for placing stop-loss orders, allowing traders to define their risk per trade precisely.
Stop-Loss Placement
The anatomy of the reversal pattern dictates the invalidation point. For a bullish pattern like a Morning Star or Hammer, the logical stop-loss is placed just below the lowest point of the pattern (the lower wick). If the price drops below this level, the structure of the reversal is broken. The buyers who stepped in at that level have been overrun, and the thesis for the trade is no longer valid.
For bearish patterns like the Shooting Star or Bearish Engulfing, the stop-loss goes above the highest wick of the formation. This high point represents the "line in the sand" where sellers successfully defended the price. If the market rallies back above this high, it means the bears have lost control, and the downtrend thesis is incorrect. Placing stops at these technical invalidation points removes emotion from the exit decision.
Interpreting False Signals
Markets are noisy, and patterns often fail. A "false signal" occurs when a pattern forms, but the price continues in the original direction. This is most common in strong trending markets where counter-trend trades are dangerous. For instance, a series of hammers might appear during a severe crash, only to be run over by continued selling.
This is why the "Trend Context" discussed earlier is vital. Trading against a strong trend (counter-trend trading) has a higher failure rate than trading a pullback within a trend. Traders should be skeptical of reversal patterns that appear in the middle of nowhere. If a pattern fails—meaning price breaks the invalidation level—traders must accept the loss immediately. Holding onto a failed trade hoping it will come back is a primary cause of capital destruction in crypto trading.
Comparative Reliability Grading
To assist in quick decision-making, traders can categorize patterns based on their complexity and typical reliability. While context always rules, three-candle patterns generally offer more inherent confirmation than single-candle patterns.
| Pattern Type | Structure | Sentiment | Reliability Factors |
|---|---|---|---|
| Hammer / Shooting Star | Single Candle | Rejection | Needs volume & next-candle confirmation |
| Bullish / Bearish Engulfing | Two Candles | Momentum Shift | Stronger if second body is large |
| Morning / Evening Star | Three Candles | Reversal | High; includes built-in confirmation |
This hierarchy helps traders allocate capital. A trader might bet smaller size on a single-candle hammer setup due to its lower inherent reliability. Conversely, a fully formed Morning Star at a support level might warrant a standard or larger position size because multiple time periods have confirmed the reversal.
Combining Indicators
For the highest possible grade, traders combine candlesticks with momentum indicators like the Relative Strength Index (RSI) or MACD (Moving Average Convergence Divergence). A bullish hammer is powerful, but a bullish hammer that appears when the RSI is oversold (below 30) is significantly stronger.
Similarly, a Bearish Engulfing pattern is more threatening if the RSI is overbought (above 70) or showing bearish divergence. The MACD can also confirm momentum shifts; a bullish crossover on the MACD occurring simultaneously with a Morning Star pattern provides robust evidence for a trade entry. These combinations create a "confluence" of signals, which is the holy grail of high-reliability trading.
Conclusion
The Candlestick Reliability Framework provides a structured method for interpreting crypto market data. It moves traders away from the dangerous habit of impulsive gambling based on isolated shapes and towards a strategic, context-aware approach. By evaluating the trend, checking the location relative to support and resistance, and demanding volume confirmation, traders can filter out low-quality signals and focus on high-probability setups.
Whether identifying the rejection in a Shooting Star or the momentum shift in a Bullish Engulfing pattern, the key lies in the story the chart is telling. The patterns are simply the language of the market. Mastering this language requires patience, discipline, and a commitment to risk management. No pattern works every time, but using a graded framework ensures that traders are consistently aligning themselves with the highest probability outcomes.
Effective trading is not about predicting the future but about reacting to confirmed changes in market psychology.