
When exploring the digital economy, many newcomers focus solely on price movements and market hype. However, the true sustainability and long-term potential of a crypto asset are dictated by its fundamental design—the economic structure known as tokenomics.
Tokenomics (a blend of "token" and "economics") refers to the characteristics and rules that govern a digital asset. It defines how a token is created, distributed, used, and how its value is intended to be maintained or increased over time. If the token is the fuel for a decentralized network, the tokenomics is the engine design blueprint.
For self-sovereign investors, mastering tokenomics is essential. It allows you to look past superficial metrics and spot potential red flags, such as impending supply shocks, overly centralized control, or unsustainable inflation rates. This guide provides the rigorous analytical framework necessary to evaluate any crypto asset like a seasoned veteran, ensuring your investment decisions are grounded in structural reality, not just speculation.
Decoding Supply: Circulating vs. Fully Diluted Valuation
The first step in any tokenomics analysis is understanding the asset’s supply structure. Unlike traditional stock markets, where the total number of shares is usually fixed and known, crypto assets often have dynamic supplies influenced by mining, burning, and scheduled releases.
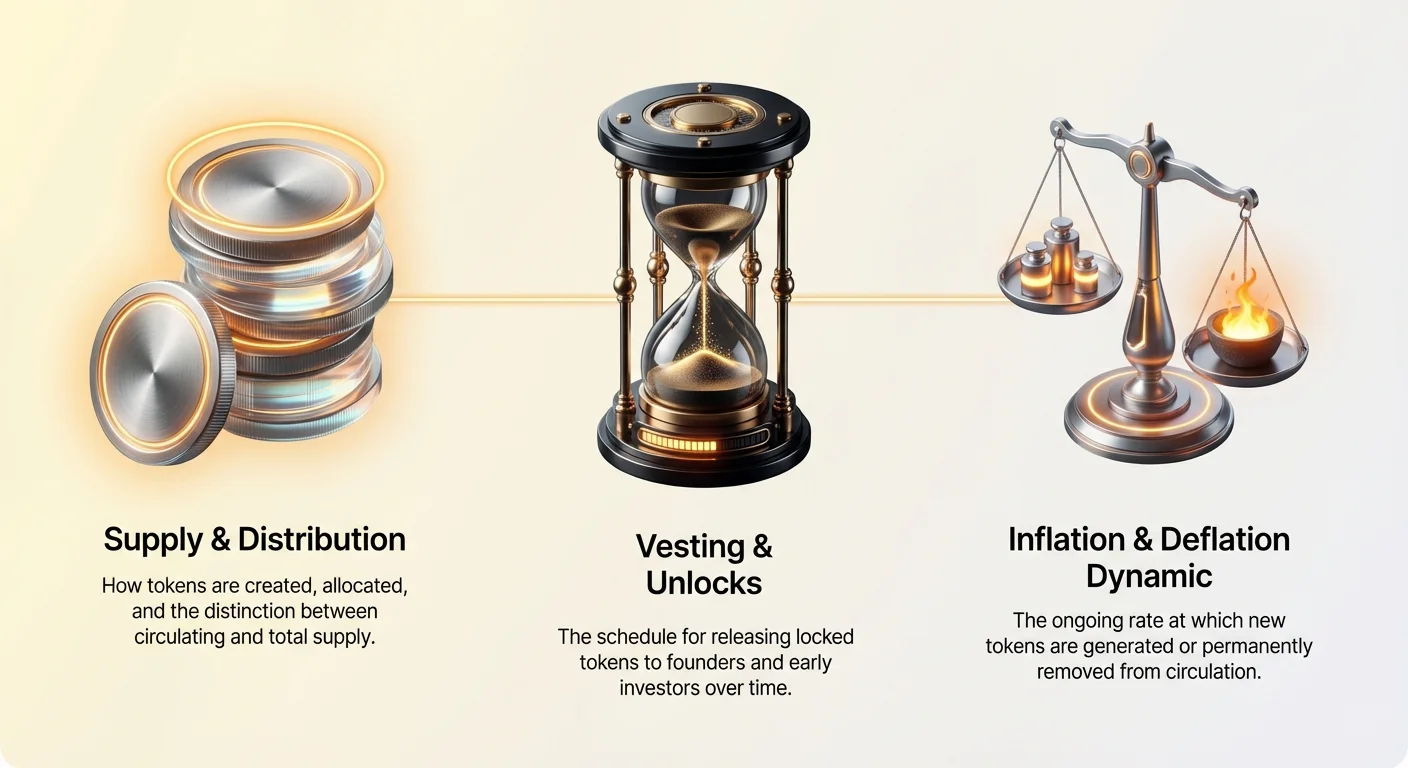
Understanding Total Supply and Circulating Supply
Every token project defines a Total Supply, which is the maximum number of tokens that will ever exist (if it has a hard cap, like Bitcoin’s 21 million), or the current maximum set by the protocol.
The Circulating Supply is the number of tokens currently available to the public and actively trading on the market.
Why the distinction matters: If a project has a Total Supply of 1 billion tokens, but only 100 million are currently circulating (10%), that means 900 million tokens are yet to enter the market. If these 900 million tokens are released too quickly, they represent a massive potential selling pressure that can dramatically depress the price.
The Critical Metric: Fully Diluted Valuation (FDV)
To account for future supply releases, analysts use the Fully Diluted Valuation (FDV). FDV answers the question: What would the market capitalization be if every single token that will ever exist was released and trading today?
The calculation is straightforward:
FDV in Practice:
Imagine Project Alpha has:
- Circulating Supply: 100 million tokens
- Current Price: $1.00
- Market Cap: $100 million
Imagine Project Beta has:
- Total Supply: 1 billion tokens (900 million are locked)
- Current Price: $1.00
- FDV: 1,000,000,000 tokens $1.00 = $1 billion
While both projects have the same market capitalization today ($100 million), Project Beta's FDV is ten times higher. This means that future growth for Beta must absorb the future sale of 900 million tokens before the existing holders see significant proportional price appreciation.
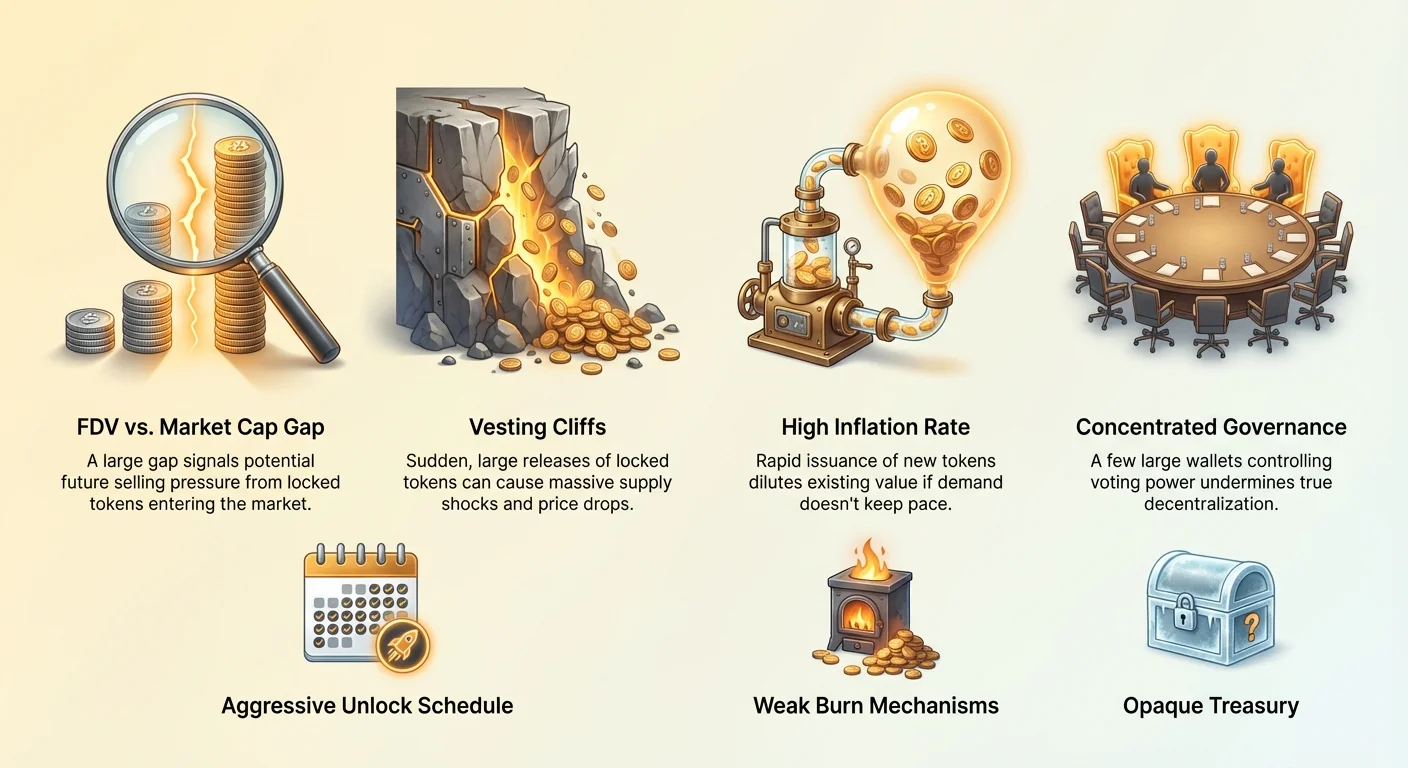
Actionable Tip: Always compare the Market Cap to the FDV. If a project's FDV is significantly higher (5x to 10x) than its Market Cap, it signals substantial inflation risk down the line due to future unlock events. High FDV relative to current Market Cap is a major tokenomics red flag unless the unlock schedule is very aggressive and the utility model is proven.
The Hidden Risks: Analyzing Vesting and Unlock Schedules
The most critical factor influencing short-to-medium-term price stability is the vesting schedule. This schedule determines when founders, early investors (Venture Capital/VCs), and development teams are allowed to sell the tokens they received at low, private-sale prices.
What is Vesting and Why Does it Exist?
Vesting is a fundamental mechanism borrowed from the traditional tech world. It ensures that those who received tokens early (often at a massive discount) are incentivized to stay with the project for the long haul. They receive their tokens not all at once, but over an extended period.
Vesting schedules typically contain two components:
- The Cliff: This is a waiting period, often 6 or 12 months, where no tokens are released. If the team leaves or fails to deliver before the cliff, they receive nothing.
- The Linear Release: Once the cliff is passed, the locked tokens begin to release to the holders daily, weekly, or monthly over the remainder of the vesting period (often 2 to 4 years).
Analyzing the Vesting Distribution:
When reviewing a whitepaper or tokenomics document, focus on the percentage of the supply allocated to these groups:
| Allocation Group | Typical Vesting Schedule | Risk Profile |
|---|---|---|
| Founders/Team | 3-4 years, 1-year cliff | Necessary alignment, but potential for large dump post-vesting. |
| Private Investors/VCs | 1-3 years, 6-12 month cliff | Most dangerous. They bought cheap and may sell aggressively at the first major pump. |
| Treasury/Ecosystem | Non-vested, controlled by governance. | Potential for centralization if distribution is poorly managed. |
| Community/Airdrops | Often fully unlocked (no vesting). | Minimal risk, as tokens are widely dispersed. |
Identifying "Supply Shocks"
A supply shock occurs when a massive, coordinated release of tokens hits the market at the same time, often overwhelming buying demand and causing the price to drop significantly.
To analyze this risk, you must map the unlock schedule:
- Find the Schedule: Locate the official schedule (usually a chart or timeline in the project’s documentation).
- Identify Key Dates: Mark the dates where the "Cliff" periods for large groups (VCs or the Team) expire.
- Calculate the Percentage: Determine what percentage of the current circulating supply is scheduled to be unlocked on that date.
Example of a Red Flag:
If the circulating supply is 100 million tokens, and the vesting schedule shows that 50 million founder/VC tokens unlock in a single month (a 50% supply increase), this is a catastrophic short-term risk, regardless of the project's utility. The market must immediately absorb a 50% increase in potential sellers.
Best Practice: Look for schedules that prioritize long, linear, and small releases over large, irregular lump-sum releases. The smoother the supply curve, the less risk of unexpected market disruption.
Case Study: Treasury Allocation and Use of Funds
While the vesting of VCs and founders is crucial, the Treasury allocation—tokens reserved for future development, grants, or ecosystem growth—warrants equal scrutiny.
Projects often reserve a significant portion of their supply (sometimes 20% to 40%) in a community treasury, managed by the core team or a decentralized autonomous organization (DAO).
What to Look For:
- Transparency: Is the treasury wallet address publicly known? Can you audit where the funds are going?
- Clear Mandate: Does the whitepaper detail how the treasury funds will be spent (e.g., grants for developers, marketing, liquidity provisioning)?
- Control: Who votes on the treasury allocation? If the initial team holds a majority of the governance power, they essentially control the funds, raising centralization concerns.
A well-designed treasury model ensures longevity and continuous development funding, but a poorly managed or opaque treasury is often a vector for unchecked insider spending.
The Inflation and Deflation Dynamic
Beyond initial unlocks, the ongoing rate at which new tokens are created or existing tokens are removed is critical to assessing an asset's long-term store of value proposition.
Inflationary vs. Deflationary Models
Token creation can generally be categorized as inflationary or deflationary:
- Inflationary Models: The supply constantly increases (e.g., tokens are continuously minted to pay for staking rewards, network security, or mining rewards). Bitcoin, which mints new coins every block, is technically inflationary until its final supply cap is hit.
- Analysis Focus: Can the utility and demand for the asset grow faster than the inflation rate? If the network issues 10% new tokens per year, the network usage must grow by more than 10% just to maintain the current price.
- Deflationary Models: The supply decreases over time, usually through "burning" mechanisms (permanently removing tokens from circulation).
- Analysis Focus: How effective is the burning mechanism? Is it tied to network activity (e.g., transaction fees are burned), or is it a one-off event?
Evaluating Staking Rewards and Emission Rates
For Layer 1 (L1) chains like Ethereum (post-Merge) or Solana, security is often guaranteed by staking, where users lock up tokens to validate transactions. In return, they receive staking rewards, which are frequently newly minted tokens.
This is where inflation becomes an economic cost:
- Identify the Source: Confirm if staking rewards come from new token issuance (inflation) or transaction fees (sustainable).
- Calculate the Net Effect: Compare the annual inflation rate (how many new tokens are minted) against the amount of tokens being burned (often through transaction fee destruction).
The Inflationary Trap:
Projects that offer extremely high staking APYs (e.g., 50% or 100%) are often paying those rewards with massive inflation. While your nominal token count increases, the value of each token rapidly dilutes. The token’s price may fall faster than your staking rewards are earned, leading to a loss of capital despite receiving a high yield. High yields often signal high long-term structural risk.
Assessing the Burning Mechanism
Deflationary mechanisms are designed to counteract inflation and reduce supply scarcity. The most robust burning models are those intrinsically tied to genuine economic activity on the network.
Strong Burn Mechanisms:
- Transaction Fee Burning (e.g., Ethereum's EIP-1559): A portion of every transaction fee is permanently removed. This means that as network usage (demand) increases, the rate of burning increases, creating a direct link between utility and scarcity.
- Protocol Revenue Burns: Tokens used to pay for specific services within the ecosystem (like domain names or NFTs) are burned.
Weak Burn Mechanisms:
- Manual or Irregular Burns: Burns decided upon by a core team (e.g., "We will burn 5% of the treasury once per year"). These are centralized, unpredictable, and less effective at creating continuous scarcity.
Analysis Rule: A tokenomics model is healthiest when its inflationary issuance (rewards) is primarily covered by its deflationary removal (fees/burns), aiming for a net-zero or net-negative inflation rate during periods of high demand.
Governance: Who Controls the Ship?
Decentralization is often cited as the core value proposition of crypto. However, tokenomics determines whether that decentralization is real or merely nominal. Governance mechanisms dictate who has the power to change the rules, allocate funds, and upgrade the protocol.
Reviewing the Governance Mechanism
Most modern crypto protocols utilize on-chain governance, where token holders vote on proposals. Analyzing this system requires understanding two key metrics:
- Quorum: The minimum percentage of the total circulating supply that must participate in a vote for the result to be considered valid. A low quorum (e.g., 2%) means critical decisions can be made by a small, engaged minority. A high quorum (e.g., 20%) ensures broader community consensus.
- Threshold: The minimum percentage of "Yes" votes required to pass a proposal.
Identifying Centralization Risk:
If the initial founder and VC wallets, even if technically "vesting," hold significant governance power, the project is highly centralized. A governance mechanism is robust only if power is widely distributed and the barrier to passing proposals (quorum/threshold) is high enough to require broad consensus.
Analyzing Power Concentration and Vote Participation
A critical step is auditing the distribution of tokens, especially among the largest holders—often called "whales."
The Whale Problem:
If a small handful of wallets (e.g., the top 100) control a majority of the circulating supply, they can easily overpower any community initiative or vote, regardless of the quorum rules.
Steps for Analysis:
- Use a Block Explorer: Utilize the project's block explorer (like Etherscan) to view the token distribution page.
- Identify the Top Holders: Look at the top 10 or top 100 holders.
- Check for Known Entities: Try to determine if these large wallets belong to the core team, VCs, or the project’s treasury. If the majority of voting power is concentrated in known insider hands, the project lacks genuine decentralization.
Practical Tip: Look for evidence of active, decentralized governance participation. Are proposals being submitted by various community members? Are the votes widely spread, or do the same few addresses dominate every decision? High participation indicates a healthy, self-regulating community.
Fully Diluted Valuation (FDV) Metrics Revisited
We previously defined FDV, but we must use it as a tool for comparative analysis.
When analyzing Altcoins, comparing the FDV of competing projects is often more telling than comparing current market caps.
Scenario:
- Competitor A (Mature L1): Market Cap $50 Billion, FDV $60 Billion (95% of supply released).
- Competitor B (New L1): Market Cap $5 Billion, FDV $50 Billion (10% of supply released).
While Competitor B seems cheaper on paper ($5B market cap), its FDV implies that it is priced almost identically to the established Competitor A ($50B vs $60B) when future supply is accounted for. For Competitor B to achieve Competitor A’s current market cap ($50B), its current price must increase tenfold, and it must successfully absorb the sale pressure from the other 90% of its locked tokens.
This perspective helps prevent investors from being misled by a low current market cap when an enormous token dilution event is inevitable.
Conclusion
Tokenomics is the rigorous study of structural value—it is the difference between investing in a sustainable business model and speculating on temporary hype. By applying critical analysis to supply dynamics (FDV), unlock schedules (vesting cliffs and linear releases), inflationary pressures, and centralization risks (governance and treasury control), you equip yourself with the tools necessary to spot fundamental red flags. For self-sovereignty to be effective, it must be paired with intellectual rigor. Use this framework to move beyond surface-level metrics and build a portfolio grounded in verifiable, long-term economic sustainability.