
Candlestick patterns serve as the language of the market, translating complex buying and selling pressure into visual stories that traders can interpret. Among the most versatile of these formations is the Harami, a pattern that signals a potential shift in market momentum through hesitation rather than brute force. Unlike aggressive reversal signals that show an immediate takeover by opposing forces, the Harami represents a moment of pause and consolidation. It suggests that the prevailing trend has hit a wall, leading to a contraction in volatility that often precedes a significant breakout or reversal.
Understanding the Harami requires looking beyond the simple shape of the candles and grasping the psychology of the market participants involved. It appears when the market takes a breath after a sustained move, creating an "inside bar" structure where the price range tightens significantly. This tightening is a critical clue for crypto traders, as periods of low volatility and indecision are frequently followed by periods of high volatility and decisive movement. By recognizing this setup, traders can anticipate breakouts rather than simply reacting to them after the move has already occurred.
The Anatomy of the Harami Structure
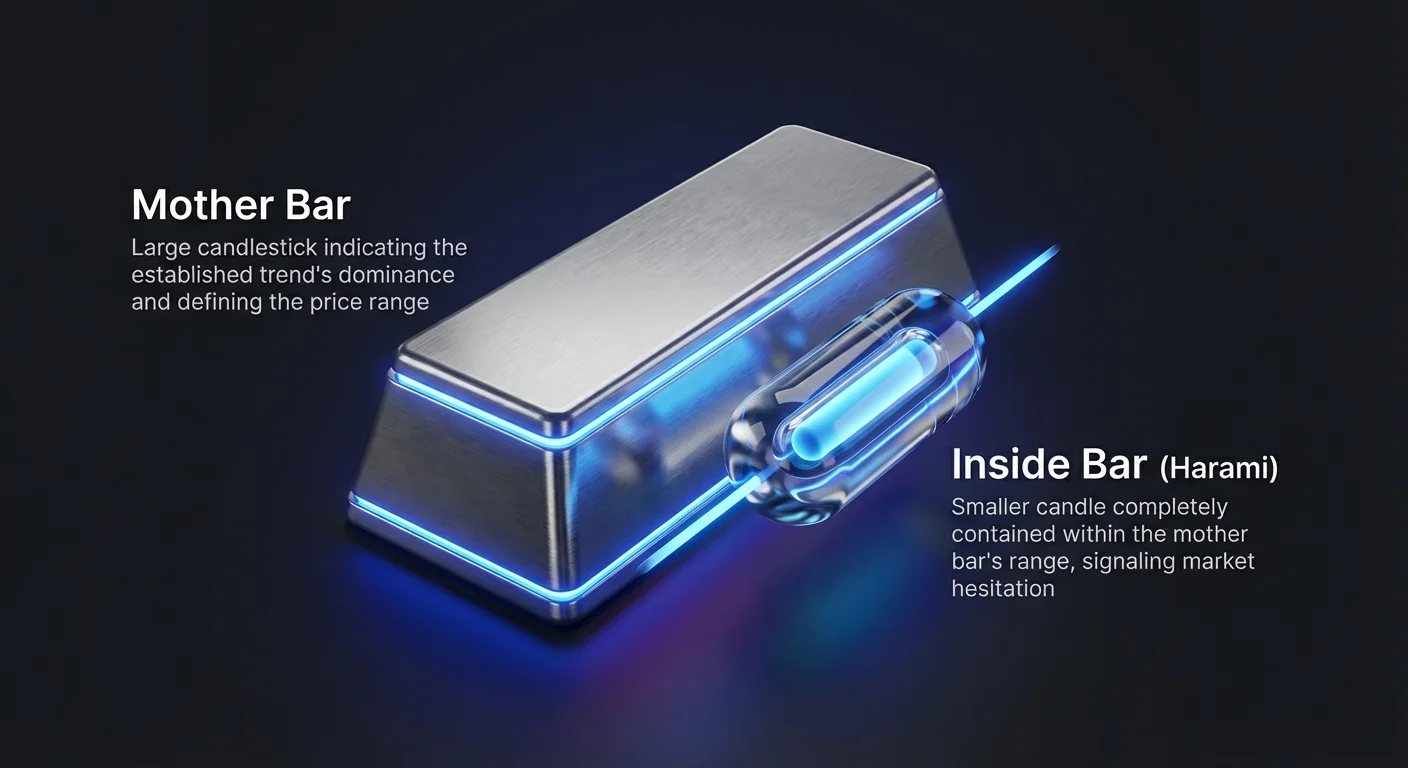
The Harami is a two-candle pattern that derives its name from the Japanese word for "pregnant," which perfectly describes its visual appearance. The first candle is known as the "mother bar," a large candlestick that represents the current trend's dominance. This candle has a wide range and a large real body, indicating that either buyers or sellers were in full control during that session. The size of this first candle sets the stage for the pattern, defining the boundaries of the immediate price action.
The second candle is the "baby" or the "inside bar." This candle is significantly smaller than the first and is completely contained within the vertical range of the mother bar's real body. Crucially, the high of the second candle is lower than the first candle's high, and its low is higher than the first candle's low. This compression of price indicates that the market has entered a state of equilibrium. The aggressive pushing of price has stopped, and neither buyers nor sellers are currently willing to drive the asset to new extremes.
Interpreting Market Psychology and Sentiment
The formation of a Harami tells a distinct story about the emotional state of the market. During a strong trend, one side of the market is clearly winning. In an uptrend, bulls are aggressively buying at higher prices; in a downtrend, bears are selling with conviction. The appearance of the mother bar confirms this sentiment is still alive. However, the sudden appearance of the inside bar signals an abrupt halt to this momentum. It represents uncertainty and a potential loss of conviction among the dominant group.
This pause often occurs because the driving force behind the trend has become exhausted. Traders who were riding the trend may begin taking profits, absorbing the incoming order flow. Simultaneously, counter-trend traders might be stepping in to test the waters, though not yet with enough strength to reverse the price immediately. The result is a standoff. For a crypto trader, this hesitation is a warning sign that the easy money in the current direction has likely been made, and a change in character is imminent.
Identifying the Bullish Harami Setup
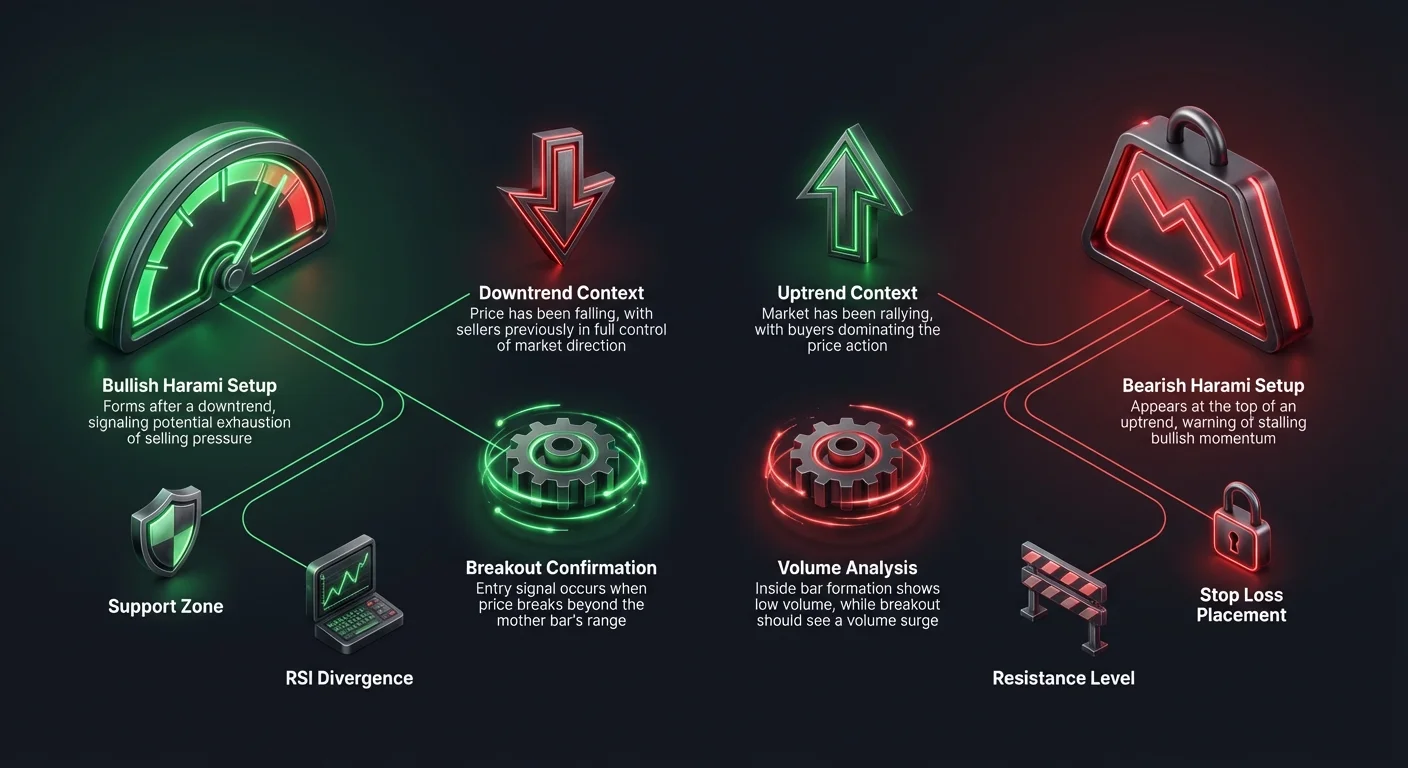
A Bullish Harami forms specifically after a downtrend, signaling that the selling pressure driving the market down is dissipating. It acts as a potential bottoming signal, suggesting that the bears are losing their grip on the price action. Identifying this pattern correctly requires strict adherence to the trend context; a Harami that forms in the middle of a sideways choppy market carries far less weight than one that appears after a steep decline.
Visual Characteristics of the Bullish Variation
The setup begins with a large bearish (red) candle that extends the current downtrend. This candle should look like a continuation of the selling pressure, with a close near the lows of the session. This convinces late sellers that the downward move is still strong. However, the next session opens higher than the previous close, which is the first sign of underlying strength. The price then fails to make a new low and trades within a narrow range, closing as a small bullish (green) or neutral candle.
The defining feature is that the small green body is completely engulfed by the previous red body. This visual suggests that the bears tried to push lower but found no liquidity, while bulls were willing to absorb the selling but not yet ready to push price aggressively higher. The market has moved from a state of high volatility selling to low volatility consolidation. This contraction often acts as a coiled spring, storing energy for a potential bullish breakout.
Trend Context and Support Zones
Context is everything when trading the Bullish Harami. The signal becomes exponentially more reliable if the pattern forms near a major support level or a historical demand zone. When price action slams into a known support area and immediately prints an inside bar, it confirms that the support level is being defended. The hesitation represented by the Harami indicates that sellers are reluctant to short into the support, while buyers are beginning to accumulate positions.
Traders should also look for this pattern after an extended series of red candles. If the market has been falling for days or weeks without a significant pullback, a Bullish Harami often marks the "exhaustion point" of that specific swing. It serves as a technical signal that the market is oversold and that a relief rally or a full trend reversal is the path of least resistance.
Recognizing the Bearish Harami Pattern
Conversely, the Bearish Harami appears at the top of an uptrend and warns that bullish momentum is stalling. It is a topping pattern that suggests buyers are exhausted and can no longer push the price to new highs. Just like its bullish counterpart, it requires a clear prior trend to be valid; it must appear after a rally to signal a true reversal of fortune.
The Shift from Buying to Indecision
The pattern starts with a large bullish (green) candle that closes near its highs, reinforcing the strength of the uptrend. Sentiment at this point is typically euphoric, with traders expecting the rally to continue. However, the following candle opens lower than the previous close and trades within a tight range, ending as a small bearish (red) or neutral candle inside the previous green body. This inability to continue the upward trajectory is a red flag for long positions.
The small inside bar indicates that the buyers have run out of steam. The volume of buy orders has dried up, or sellers have begun unloading large positions into the rally, capping the upside. While the price hasn't collapsed yet, the momentum has clearly shifted from "aggressive buying" to "wait and see." This pause often allows supply to build up, eventually overpowering the remaining demand and triggering a downward move.
Resistance Levels and Supply Zones
A Bearish Harami is most potent when it forms at a key resistance level or a psychological price barrier. If an asset rallies into a resistance zone and immediately forms an inside bar, it indicates a rejection of higher prices. The market is testing the ceiling and finding it solid. This setup provides a logical area for traders to exit long positions or consider initiating short trades, as the risk-reward ratio is clearly defined by the high of the pattern.
Confirmation and Execution Strategies
A solitary candlestick pattern, no matter how distinct, should rarely be traded in isolation. The Harami represents potential, not a guarantee. To trade it effectively, traders must wait for confirmation that the hesitation has resolved in the direction of the reversal. This patience reduces the frequency of trades but significantly increases their quality and probability of success.
The Importance of the Breakout Candle
The signal to enter a trade comes not when the Harami forms, but when the price breaks out of the mother bar's range. For a Bullish Harami, traders watch for a price move that breaks above the high of the mother candle. This break confirms that the buyers have won the standoff and are pushing prices higher. Without this confirmation, the inside bar could simply be a pause before the downtrend continues.
For a Bearish Harami, the trigger is a break below the low of the mother candle. This confirms that the sellers have taken control and are driving the price down. Some aggressive traders may use the break of the inside bar (the baby candle) as an early entry, but this carries higher risk. Waiting for the mother bar's range to be breached provides a stronger confirmation that the market structure has indeed shifted.
Integrating Volume Analysis
Volume provides the fuel for any sustained price move. Ideally, the formation of the Harami inside bar should be accompanied by a drop in trading volume. This decrease in volume confirms the lack of participation and the "wait and see" approach of the market. It validates the consolidation aspect of the pattern.
However, when the breakout occurs—whether up or down—it should be supported by a surge in volume. A breakout on high volume indicates that institutional money is behind the move and that the new trend direction has conviction. If the price breaks out of the Harami range on weak volume, it is more likely to be a false breakout or a "fakeout," where price briefly moves beyond the range before snapping back.
Technical Indicators for Confluence
Combining candlestick patterns with technical indicators creates a more robust trading strategy. Indicators can provide the "why" behind the "what" shown by the price action. By layering these tools, traders can filter out low-quality setups and focus on those with the highest probability of following through.
RSI and Overbought/Oversold Conditions
The Relative Strength Index (RSI) is an excellent companion for the Harami pattern. When a Bearish Harami forms, traders should check if the RSI is in overbought territory (typically above 70). An overbought reading confirms that the rally may be overextended and due for a correction, adding weight to the reversal signal.
Conversely, when identifying a Bullish Harami, an RSI reading below 30 (oversold) strengthens the case for a bounce. If the Harami appears while the RSI is showing "bullish divergence"—where price makes a lower low but RSI makes a higher low—the signal is even more powerful. This divergence indicates that while price is falling, the momentum of the fall is weakening, aligning perfectly with the story told by the inside bar.
MACD Crossovers and Momentum
The Moving Average Convergence Divergence (MACD) indicator can also validate the setup. A Bullish Harami that coincides with a bullish MACD crossover (or a histogram that is ticking upwards towards zero) suggests that momentum is shifting in favor of the buyers. This lag in the indicator can sometimes align perfectly with the consolidation phase of the Harami, providing a timely signal for entry.
For bearish setups, a Bearish Harami forming as the MACD lines begin to pinch or cross downwards indicates that the upward momentum is draining away. Using these momentum oscillators helps confirm that the pause seen in the price action is backed by a mathematical shift in the trend's velocity.
Risk Management and Trade Management
No trading setup works 100% of the time, making risk management the cornerstone of longevity in crypto markets. The defined structure of the Harami provides clear reference points for placing stop-loss orders, allowing traders to calculate their risk precisely before entering a position.
Setting Stop Losses
For a Bullish Harami trade, the logical stop-loss placement is just below the lowest point of the pattern. This is usually the low of the mother candle. If price breaks below this level, it invalidates the reversal thesis and indicates that the downtrend is continuing. Placing the stop here protects capital from a failed reversal attempt.
In a Bearish Harami setup, the stop-loss should be placed above the highest point of the pattern, which is typically the high of the mother candle. If the price rallies and takes out this high, the pattern has failed, and the uptrend is likely resuming. Keeping stops tight to these structural levels ensures that losses are small relative to potential gains.
| Setup Type | Context | Trigger Condition | Stop Loss Location |
|---|---|---|---|
| Bullish Harami | Downtrend | Break above Mother High | Below Mother Low |
| Bearish Harami | Uptrend | Break below Mother Low | Above Mother High |
Defining Take-Profit Targets
Profit targets should be determined by the market structure that preceded the pattern. For a bullish reversal, traders can look to previous resistance levels, swing highs, or moving averages as potential exit points. Since the Harami often captures the very beginning of a new trend, the potential reward can be significant relative to the risk.
Traders may also use a trailing stop strategy. Once the price moves in the anticipated direction, the stop loss can be moved to breakeven or trailed behind subsequent support levels. This allows the trader to capitalize on extended trends that may result from the reversal while protecting open profits if the market suddenly turns again.
Limitations and Common Pitfalls
While effective, the Harami is not without its flaws. It is primarily a signal of declining volatility, which does not always guarantee a reversal. In strong trending markets, a Harami may simply act as a brief pause before the dominant trend continues. This is known as a continuation pattern, where the inside bar serves as a resting point rather than a turning point.
This ambiguity is why confirmation is non-negotiable. Jumping into a trade solely because an inside bar formed is a recipe for losses. In lower timeframes, such as the 1-minute or 5-minute charts, Harami patterns appear frequently and often result in market noise rather than tradeable signals. The pattern is generally more reliable on higher timeframes like the 4-hour, daily, or weekly charts, where the consolidation represents a significant period of market activity.
Another limitation is the "fakeout," where price briefly breaks the mother bar's range only to reverse back inside. This trap catches eager traders who enter too early. Waiting for a candle close outside the range, rather than just a wick, can help mitigate this risk, though it may result in a slightly worse entry price.
Conclusion
The Harami setup offers crypto traders a sophisticated way to read market sentiment, moving beyond simple price direction to understand the nuances of volatility and hesitation. It serves as an early warning system, alerting the observant trader that the prevailing trend is losing energy and that a change in market character is approaching. By identifying the contraction in price represented by the inside bar, traders can position themselves to take advantage of the inevitable expansion that follows.
However, the power of the Harami lies not in the pattern itself, but in its context. A Harami forming at a random price point is merely noise; a Harami forming at a major support or resistance level, backed by divergence on the RSI and a shift in volume, is a high-probability trading opportunity. Success comes from synthesizing these elements—structure, location, and momentum—into a cohesive trading plan.
Mastering the Harami requires patience to wait for the setup, discipline to wait for confirmation, and the prudence to manage risk when the market defies expectations.