
Understanding the price movements of volatile assets like Bitcoin requires more than just looking at candlestick charts. While traditional finance relies heavily on macroeconomic reports and fundamental company data, the crypto market offers a unique advantage: transparency. Because every transaction is recorded on a public ledger, sophisticated investors can analyze the quantifiable actions of the market’s most influential participants—the supply creators, the large holders, and the exchanges where trading occurs.
This analytical approach shifts the focus from passively observing price to actively understanding the supply and demand mechanics driven by specific actors. We move beyond simple valuation models to analyze short-term pressure, accumulation patterns, and underlying network stability.
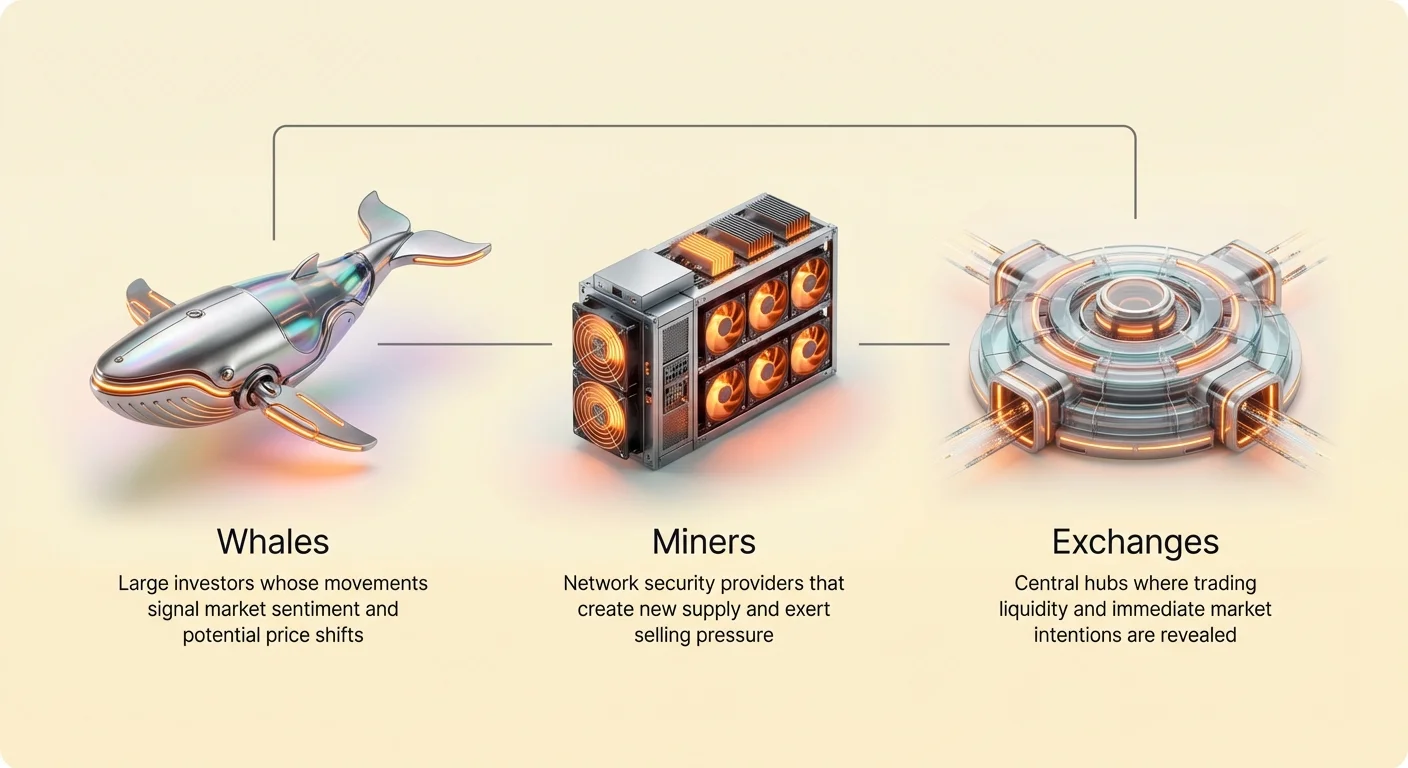
This guide adopts the perspective of a crypto investment analyst, detailing how to track and interpret the behaviors of "whales" (large investors), "miners" (the backbone of the network), and "exchange flows" (the immediate pulse of market intent) to build a robust investment thesis.
The Influence of Bitcoin Whales: Tracking Deep-Pocketed Holders
In any financial market, large-scale investors—often called "whales" due to their market-moving size—hold disproportionate power. In Bitcoin, tracking these entities is possible because blockchain analysis allows us to monitor wallets holding significant amounts of BTC. Whale movements often signal underlying confidence or pending distribution events.
Defining "Whale" Status: Wallet Cohorts and Supply Segmentation
A Bitcoin "whale" is generally defined as an entity controlling a large number of coins (often 1,000 BTC or more) across one or several related addresses. However, modern on-chain analysis segregates all holders into categorized cohorts to better segment their influence:
- Shrimps (Under 1 BTC): Represent the vast majority of individual retail investors. Their cumulative holdings are significant, but their individual trades have minimal impact.
- Crabs/Octopuses (10–100 BTC): Small-to-medium investors, often the first to buy in dips or sell during rallies.
- Sharks/Dolphins (100–1,000 BTC): High-net-worth individuals or smaller institutions. Their accumulation signals serious intent.
- Whales (1,000–5,000 BTC) and Humpbacks (5,000+ BTC): These are the institutions, funds, and earliest adopters whose activity can dramatically swing market sentiment and liquidity, particularly during periods of low volume.
By tracking the collective accumulation or distribution activity of these specific cohorts, analysts can gauge conviction levels. If Humpbacks are heavily accumulating while Shrimps are selling, it suggests smart money is positioning itself for a long-term move.
Whale Behavior Analysis: Accumulation vs. Distribution
The primary metric derived from whale tracking is the net position change over time.
Accumulation: When large wallets pull BTC off exchanges and hold it in private, non-custodial addresses (cold storage), they are effectively removing sellable supply from the market. This signals confidence and a commitment to HODLing (holding for the long term). Sustained accumulation by large holders typically precedes major uptrends, as the available supply shrinks.
Distribution: When whales move large quantities of BTC onto centralized exchanges, it usually means they are preparing to sell. This inflow adds immediate short-term selling pressure. Large, sudden spikes in whale deposits are often correlated with local price tops, as these large holders take profits into rallies.
Practical Metric: Stablecoin Flows and Market Entry
While tracking BTC flows is essential, watching stablecoin activity provides critical forward guidance regarding potential demand. Stablecoins (like USDT and USDC) act as the primary on-ramp and off-ramp liquidity within the crypto ecosystem.
When whales move massive amounts of stablecoins onto centralized exchanges, they are signaling imminent buying power. They are positioning fiat-equivalent cash to quickly acquire BTC or other assets. Conversely, when large stablecoin reserves are withdrawn from exchanges, it might suggest profit-taking is complete, and the funds are moving into private treasuries or being settled outside the crypto ecosystem.
Analyzing large, coordinated stablecoin inflows often acts as a precursor to significant rallies, providing a strong signal of deep-pocketed demand returning to the market.
The Critical Role of Bitcoin Miners in Supply and Security
Bitcoin miners are the production engine of the network. They secure the blockchain by validating transactions and, in exchange, receive newly minted BTC (the block reward) plus transaction fees. Their operations create the essential supply-side pressure in the market.
Understanding Miner Economics: Costs, Revenue, and Profitability
Miners are industrial businesses that operate on tight margins. Their revenue is generated entirely by the block reward (currently 6.25 BTC, plus fees), while their major costs are electricity, cooling, and capital expenditure (hardware).
This creates a constant miner selling pressure. Miners must frequently sell a portion of their earned BTC to cover their operational costs (known as the "energy ceiling"). When the price of BTC is high, they can cover costs by selling a smaller fraction of their reward, allowing them to accumulate the rest. When the price drops or the network difficulty increases, their profit margins shrink, forcing them to sell a larger percentage, or even their accumulated reserves, just to stay solvent.
Miner Selling Pressure (The "Capitulation" Event)
The most stressful period for miners—and a key analytical signal for investors—is miner capitulation. Capitulation occurs when the cost of mining exceeds the revenue generated, forcing less efficient or over-leveraged miners to shut down their machines and dump their remaining BTC reserves to pay off debts.
This is measured by metrics like the Hash Ribbon indicator, which tracks the 30-day and 60-day moving averages of the hash rate.
- Capitulation Phase (Bearish/Bottom Signal): When the hash rate drops significantly (the 30-day MA crosses below the 60-day MA), it signals that a large number of miners have gone offline. The market experiences forced selling pressure as these miners liquidate reserves. Historically, the capitulation period marks the final, painful wave of selling and often coincides with the absolute bottom of a bear market cycle.
- Recovery Phase (Bullish Signal): Once the weaker miners are flushed out, the hash rate stabilizes and begins to rise again. The remaining, more resilient miners command a larger share of the rewards, leading to a "miner recovery" phase. This period usually confirms that the worst selling is over and sets the stage for a new bull run.
Hash Rate and Network Security as a Market Signal
The hash rate—the total computational power dedicated to the Bitcoin network—is not just an indicator of miner profitability; it is the ultimate measure of the network's security and health.
A high and rising hash rate confirms the network is robust, decentralized, and difficult to attack. For investors, a stable or increasing hash rate is a crucial fundamental factor supporting Bitcoin’s long-term proposition as a reliable "store of value" and secure settlement layer. If the hash rate were to consistently decline without price compensation, it would suggest fundamental instability. Conversely, new all-time highs in hash rate are highly bullish, indicating increasing institutional and industrial commitment to the network, regardless of short-term price volatility.
Exchange Flow Dynamics: The Window into Short-Term Intent
While whale activity provides insight into deep-pocketed sentiment, tracking exchange flow dynamics provides the clearest, most immediate view of short-term investor intentions and market liquidity. Centralized exchanges (CEXs) are the choke points where the majority of buying, selling, and leveraged trading takes place.
Net Position Change: Inflows vs. Outflows
The exchange net position change is arguably the most vital metric for short-term analysis. It measures the difference between the total BTC flowing onto exchanges (inflows) and the total BTC flowing off exchanges (outflows) over a set period.
- Net Inflow (Bearish Pressure): When BTC deposits significantly exceed withdrawals, it means people are moving coins from cold storage or personal wallets onto the exchange trading books. This action is usually taken in preparation to sell or trade, leading to an increase in available supply and, consequently, short-term selling pressure.
- Net Outflow (Bullish Signal): When withdrawals significantly exceed deposits, it signals that investors are pulling their BTC off exchanges and moving them into secure, private cold storage. This is a strong HODL signal, indicating that investors are unwilling to sell at current prices and are removing supply from the immediate market. Sustained net outflows are a prerequisite for major supply shocks and subsequent price rallies.
Exchange Balance Decline (The HODLing Signal)
The Total Exchange Balance is the cumulative amount of BTC held across all tracked centralized exchange wallets. This metric is a powerful proxy for aggregate market risk.
A continually declining exchange balance means that the total available supply of BTC that could be sold at any moment is shrinking. This signifies collective conviction and self-custody adoption. As the accessible liquid supply dwindles, the market becomes increasingly vulnerable to sharp upward moves when demand arrives—a fundamental supply shock dynamic.
Conversely, a rapidly rising total exchange balance suggests high uncertainty. Investors are parking large amounts of coins on exchanges, ready to sell immediately if sentiment turns negative, creating a latent overhang of selling pressure.
Analyzing Derivatives and Funding Rates
While spot market flows (actual BTC buying/selling) are the foundation, the derivatives market (futures and perpetual swaps) often dictates short-term volatility, especially through leverage.
Funding Rate: This is a small, periodic payment made between leveraged traders.
- Positive Funding Rate: Long traders (those betting on a price rise) are paying short traders. This means the market is overly bullish, aggressively leveraged long, and potentially overheated. High positive funding rates often precede a "long squeeze" or liquidation cascade.
- Negative Funding Rate: Short traders (those betting on a price drop) are paying long traders. This indicates the market is overly bearish. Extremely negative rates can signal a near-term bottom, as short sellers become susceptible to a swift "short squeeze."
Monitoring funding rates in conjunction with exchange flows allows analysts to gauge whether the selling pressure is spot-driven (actual liquidation) or derivative-driven (leveraged traders being wiped out).
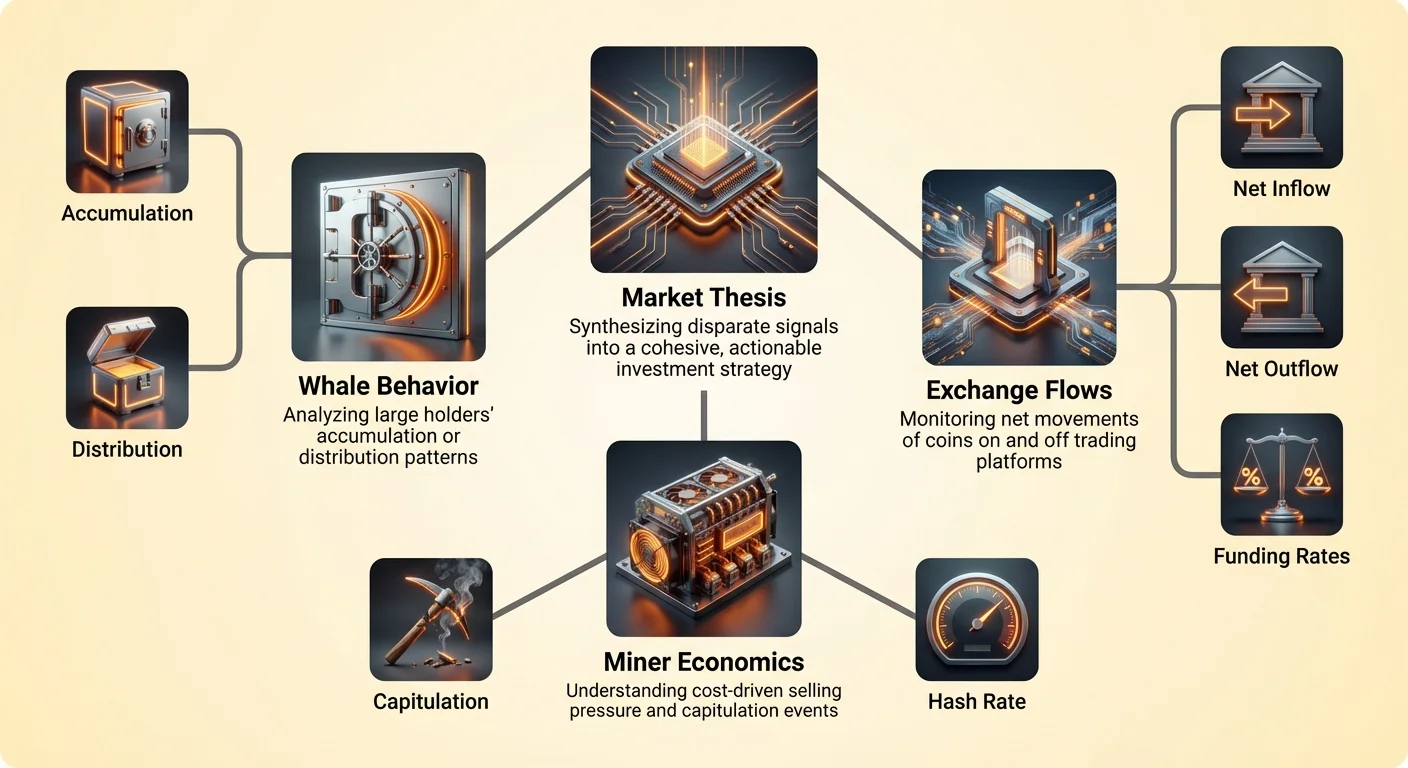
Synthesizing the Data: Building a Market Thesis
Analyzing whales, miners, and exchange flows in isolation provides partial insights. The true power of market structure analysis comes from synthesizing these disparate signals into a cohesive, actionable thesis.
Combining Whale, Miner, and Exchange Signals
The interactions between these three actors often explain rapid price movements that seem counterintuitive on simple price charts.
| Whale Activity | Miner Activity | Exchange Flow | Market Thesis |
|---|---|---|---|
| Accumulation (Holding) | Capitulation (Selling aggressively) | Net Outflow (Removing BTC) | STRONG BOTTOM SIGNAL: Whales are absorbing forced miner selling and moving coins to cold storage. Supply is shrinking while high conviction money enters. |
| Distribution (Depositing to sell) | Profitable (Low selling) | Net Inflow (Depositing to sell) | RISK OF CORRECTION: The largest holders are distributing supply into the market, suggesting a temporary top or desire to realize gains. |
| Neutral/Slight Accumulation | Profitable (Selling standard amount) | Total Balance Rising (Waiting) | UNCERTAINTY: Market is waiting for a catalyst. Liquidity is high, meaning small events could trigger large volatility. |
By cross-referencing these positions, an investor can determine if short-term bearish pressure (like miner selling) is being absorbed by high-conviction long-term holders (whales), or if that selling is compounding with broader market liquidation.
Key Risks and Limitations of On-Chain Analysis
While powerful, market structure analysis through on-chain data is not infallible and must be tempered with caution:
- Wallet Ownership Ambiguity: We can see what a wallet does, but we don't always know who controls it (e.g., Is it a hedge fund, an individual, or a corporate treasury like MicroStrategy?). This limits the certainty of "intent."
- Internal Transfers: Large movements of coins from one address to another might not be a sale but simply an exchange shuffling cold storage, or a custodian moving client funds. Analysts must use filtering heuristics to distinguish genuine market movement from internal operations.
- Black Swan Events: On-chain data primarily tracks organic supply and demand. It cannot predict sudden, non-quantifiable external events like regulatory crackdowns, global macro instability, or unexpected technological failures, which can override all accumulated technical signals.
To mitigate these limitations, market structure analysis should always be combined with macro frameworks discussed in pages like On-Chain vs. Macro Valuation Models and contextualized with knowledge of the major supply dynamics covered in Supply Shock Economics: Analyzing the Bitcoin Halving Cycle.
Conclusion
The price of Bitcoin is not a random walk; it is the observable output of quantifiable actions taken by major market participants. By studying the flows driven by whales, the fundamental economics of miners, and the immediate pressures reflected in exchange balances, investors move beyond speculation and gain an analytical edge.
Tracking market structure actors allows investors to understand where the supply is going (cold storage vs. exchanges) and who is creating the short-term volatility (leveraged traders vs. forced sellers). This sophisticated approach forms the foundation of a proactive investment thesis, enabling strategic decisions during peak euphoria and maximum pain. This shift from passive observation to active analysis is a crucial step on the path toward financial self-sovereignty in the digital economy.