
Analyzing cryptocurrency markets often feels like navigating a chaotic environment where prices move randomly. However, experienced traders understand that markets are governed by supply and demand dynamics driven by institutional participants. This structural approach to analysis relies on identifying recurring patterns known as market cycles. One of the most respected frameworks for interpreting these cycles is the Wyckoff Methodology. This approach focuses on the relationship between price action, volume, and time to determine the likely future direction of an asset.
At the core of this methodology is the concept that markets do not move in a straight line. Instead, they transition between phases of balance and imbalance. Large market participants, often referred to as "smart money" or institutional investors, cannot enter or exit positions instantly without disrupting the price. Therefore, they must slowly build positions during specific periods or gradually sell off their holdings during others. Recognizing these footprints allows retail traders to align their strategies with the dominant market forces rather than fighting against them.
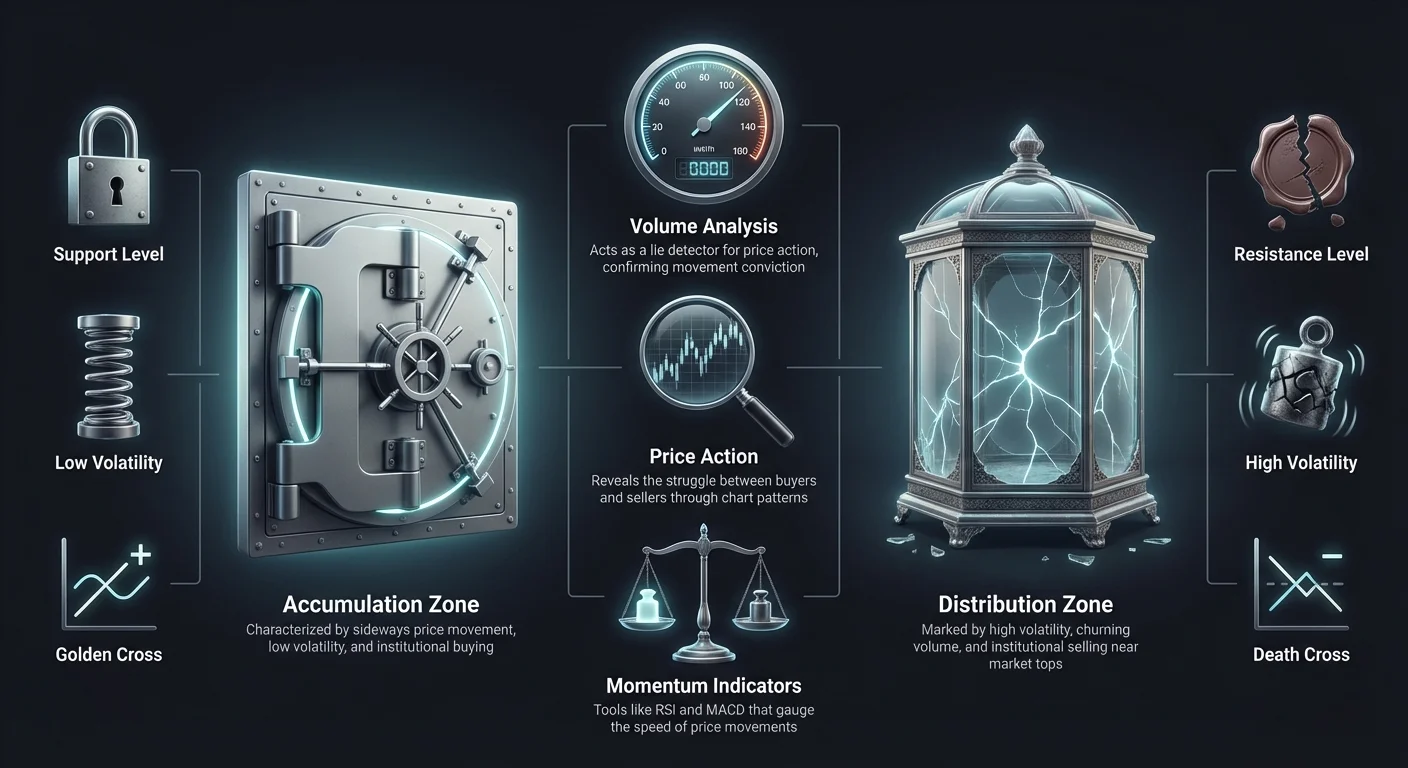
Successful application of this method requires a deep understanding of chart reading and technical indicators. By mastering the analysis of price trends, trading volume, and momentum, investors can spot the subtle signs of accumulation and distribution. This guide explores the fundamental mechanics of these cycles. It details how to use technical tools to identify when smart money is buying or selling.

The Core Components of Market Analysis
Analyzing Price Action Through Charts
The first step in identifying market cycles is understanding how price data is visualized. Charts provide a historical record of asset performance, and different types of charts offer varied perspectives. Line charts connect closing prices over a set period. They offer a clean, simple view of the overall trend but lack detailed information about price behavior within specific intervals. This makes them useful for seeing the "big picture" of a market cycle but less effective for spotting precise entry points.
Candlestick charts are the preferred tool for detailed cycle analysis. Each candlestick displays the open, high, low, and close prices for a specific timeframe. The body of the candle shows the difference between the open and close, while the wicks indicate the extreme highs and lows. This structure reveals the struggle between buyers and sellers. For instance, a long lower wick suggests that sellers pushed the price down, but buyers stepped in to push it back up. This often signals support during an accumulation phase.
The Critical Role of Trading Volume
Price action alone tells only half the story. Trading volume provides the necessary context to validate price movements. Volume represents the total amount of an asset traded during a specific period. In the context of market cycles, volume acts as a lie detector for price action. A significant price movement accompanied by high volume indicates strong conviction from market participants. This confirms that the trend is valid and likely to continue.
Conversely, price movements on low volume suggest a lack of interest or conviction. If a price breaks out of a range but volume remains low, it may be a "trap" or a false breakout. Institutional traders often use periods of high volume to mask their activities. For example, they may sell into a rising market (distribution) or buy into a falling market (accumulation). Monitoring volume anomalies helps traders spot when the "smart money" is active, even if the price hasn't moved significantly yet.
Volatility and Market Sentiment
Volatility measures the speed and extent of price changes. It is a key characteristic used to distinguish between different cycle phases. High volatility is often associated with uncertainty and emotional trading. This is frequently seen during the end of a distribution phase or the panic of a market crash. During these times, prices swing wildly as fear and greed dominate investor behavior.
Low volatility, on the other hand, often characterizes the accumulation phase. As the market settles and institutional investors quietly build positions, price ranges tighten. This period of calm often precedes a significant expansion in price. Understanding volatility helps traders manage their expectations and risk. It also aids in identifying the psychological state of the market, providing clues about whether the cycle is nearing a turning point.
Understanding the Market Cycle Phases
The Accumulation Phase
The accumulation phase occurs after a downtrend when the selling pressure begins to dissipate. During this period, the asset is often considered undervalued. Institutional investors and "smart money" begin to buy the asset gradually to avoid spiking the price. This phase is characterized by sideways price movement, often referred to as a trading range or consolidation. The general public is usually bearish or indifferent during this time, having lost interest due to the preceding price decline.
Identifying accumulation requires patience. Traders look for specific signs such as a decrease in volatility and volume patterns that support buying. While the price moves horizontally, volume often increases on up-moves and decreases on down-moves. This subtle shift indicates that demand is slowly overcoming supply. The goal during accumulation is to position oneself before the markup phase begins, capturing the subsequent trend from its early stages.
The Markup and Markdown Phases
Once the available supply has been absorbed during accumulation, the price is ready to move. This leads to the markup phase, commonly known as a bull market. During this phase, demand exceeds supply, and the price trends upward. Technical indicators like the Golden Cross, where a short-term moving average crosses above a long-term one, often confirm the start of this phase. Traders observe higher highs and higher lows, supported by increasing volume on rallies.
Eventually, the trend reaches a point of exhaustion, leading to distribution. Following distribution, the market enters the markdown phase, or bear market. Supply exceeds demand, and the price declines. This phase is confirmed by signals such as the Death Cross, where a short-term moving average crosses below a long-term one. Identifying the transition from markup to distribution, and eventually to markdown, is crucial for preserving capital and avoiding large losses.
The Distribution Phase
Distribution is the counterpart to accumulation. It occurs after an extended uptrend when the asset is overvalued. Smart money uses the strong buying demand from retail investors to offload their large positions. Like accumulation, distribution often takes place within a sideways trading range. However, the characteristics are different. Volatility tends to be high, with sharp price swings that lure retail traders into thinking the uptrend will continue.
During distribution, volume analysis becomes critical. Traders often see high volume without significant price progress, known as "churning." This indicates that despite strong buying effort, aggressive selling is absorbing the demand. Price patterns may show signs of weakness, such as lower highs or failure to break resistance. Recognizing distribution allows traders to exit positions and lock in profits before the markdown phase begins.
Technical Tools for Identifying Cycles
Moving Averages and Crossovers
Moving averages (MAs) are essential tools for smoothing out price data to identify the underlying trend. They are particularly useful for confirming cycle transitions. The most common MAs used are the 50-day and 200-day simple moving averages. These indicators lag behind price, meaning they confirm a trend rather than predict it. However, their reliability makes them a staple in cycle analysis.
The interaction between these two moving averages provides powerful signals. A Golden Cross occurs when the 50-day MA crosses above the 200-day MA. This signals that short-term momentum is outpacing the long-term average, often marking the transition from accumulation to a markup phase. Conversely, a Death Cross occurs when the 50-day MA crosses below the 200-day MA. This warns that the long-term trend is turning bearish, signaling the potential start of a markdown phase.
Momentum Oscillators
Momentum oscillators help traders gauge the speed of price movements and identify overextended conditions. The Relative Strength Index (RSI) is a popular tool that measures the magnitude of recent price changes. It ranges from 0 to 100. An RSI above 70 generally indicates an overbought condition, common during distribution. An RSI below 30 suggests an oversold condition, often seen during accumulation.
The Stochastic Oscillator is another valuable indicator. It compares a closing price to its price range over a specific period. Like the RSI, it helps identify potential reversal points. When the Stochastic lines cross in overbought or oversold territory, it can signal a shift in momentum. These tools are most effective when used to confirm observations from price action and volume, rather than as standalone buy or sell signals.
Advanced Cycle Indicators
For more precise analysis, traders may use specialized indicators like the Pi Cycle Top. This tool uses specific moving average combinations to identify potential market peaks. Historically, it has been effective in signaling the top of Bitcoin market cycles. By comparing short-term and long-term trends, it highlights moments when the market is significantly overheated.
Another useful tool is the Moving Average Convergence Divergence (MACD). This indicator tracks the relationship between two moving averages of a price. The MACD consists of a MACD line, a signal line, and a histogram. Crossovers between the MACD line and the signal line indicate shifts in momentum. Divergences between the MACD and price are particularly powerful. For example, if the price makes a new high but the MACD does not, it suggests weakening momentum, a common sign of distribution.
Analyzing Accumulation in Detail
Price Action Characteristics
During the accumulation phase, price action is defined by a battle between lingering supply and growing demand. The price typically moves within a defined horizontal range, bounded by support and resistance levels. The support level represents the price at which buyers see value and step in to purchase. The resistance level is where sellers are still active. This range-bound movement can last for weeks or even months.
Candlestick patterns play a vital role in spotting accumulation. Traders look for bullish reversal patterns near the support level. A Hammer candle, for instance, shows that sellers pushed the price down, but buyers returned with strength to close near the open. This indicates rejection of lower prices. Similarly, a Bullish Engulfing pattern suggests that buying pressure has overwhelmed selling pressure. These patterns, appearing repeatedly at support, reinforce the validity of the accumulation zone.
Volume Signatures
Volume analysis distinguishes genuine accumulation from a mere pause in a downtrend. In an ideal accumulation schematic, volume should diminish as the trading range develops. This indicates that the selling pressure is drying up. As the phase progresses, traders look for localized spikes in volume on upward price moves. This suggests that institutional buyers are aggressively stepping in.
Conversely, volume on downward moves toward the support level should be light. If the price drops to support on heavy volume, it suggests that supply is still dominant, and the support may fail. The "Spring" is a classic accumulation concept where price briefly breaks below support on low volume, shaking out weak hands, before quickly reclaiming the range. This final test of supply often precedes the breakout into the markup phase.
| Feature | Accumulation Phase | Distribution Phase |
|---|---|---|
| Trend Context | Follows a downtrend | Follows an uptrend |
| Volume Trend | Increases on rallies | Increases on declines |
| Volatility | Low / Decreasing | High / Increasing |
Confirmation Signals
Confirming the end of accumulation is crucial to avoid entering a trade too early (dead money) or too late (chasing). A decisive breakout above the resistance level of the trading range is the primary confirmation. This breakout should be accompanied by a significant surge in volume. High volume proves that the breakout is backed by smart money and is not a false move.
Retests of the breakout level also offer confirmation. After breaking resistance, the price often pulls back to test the level as new support. If this pullback occurs on low volume and holds, it validates the transition to the markup phase. Additionally, momentum indicators like the RSI should move into bullish territory (above 50 or 60) and stay there, reflecting the sustained strength of the new trend.
Analyzing Distribution in Detail
Detecting Weakness at the Top
Distribution phases are often deceptive because they occur while the general sentiment is still euphoric. The price may continue to make new highs, but the quality of the trend deteriorates. This phenomenon is known as divergence. Price action becomes choppy and overlapping, signaling that the smooth upward momentum is gone. Institutions are selling into the buying strength, capping further gains.
Candlestick patterns at the top of the range provide early warnings. A Shooting Star candle, which has a small body and a long upper wick, indicates that buyers pushed the price up, but sellers forced it back down. This rejection of higher prices is a hallmark of distribution. Bearish Engulfing patterns and large red candles with little to no lower wicks also signal that sellers are taking control of the market.
Volume Warnings
Volume behavior in distribution is the inverse of accumulation. Traders should watch for "supply spikes"—days with high volume but little price appreciation or even price declines. This suggests that large sell orders are absorbing all the buying interest. If the price makes a new high but volume is lower than on previous highs, it indicates a lack of institutional participation.
Another warning sign is high volume on down-days or breaks of minor support levels within the range. This shows that sellers are aggressive. The "Upthrust" is a common distribution event where price briefly breaks above resistance on lower volume, enticing retail buyers, before sharply reversing back into the range. This trap locks in late buyers who will be forced to sell as the price drops.
Confirmation of the Markdown
The transition from distribution to the markdown phase is confirmed when the price breaks below the support level of the trading range. Like the accumulation breakout, this breakdown should be supported by high volume, indicating a rush to exit. Once this support is broken, it often acts as resistance in the future.
Technical indicators reinforce this bearish shift. The MACD may show a bearish crossover or divergence, where momentum drops despite price highs. The RSI may fail to reach overbought levels on rallies and start dipping below 40 or 30. Finally, a Death Cross on the moving averages provides the ultimate lagging confirmation that the long-term trend has shifted from bullish to bearish.
Risk Management in Cycle Trading
Strategic Position Sizing
Trading based on market cycles requires disciplined risk management. Even the best analysis cannot guarantee a specific outcome. Position sizing is the practice of allocating only a specific percentage of a portfolio to a single trade. This ensures that a failed setup does not cause catastrophic damage to the overall account.
In the context of accumulation, traders might start with a smaller "pilot" position as the range develops. They can then add to the position as confirmation signals appear, such as a high-volume breakout or a successful retest. This technique, known as pyramiding, allows traders to maximize exposure when the probability of success is highest while minimizing risk during the uncertain consolidation period.
Using Stop-Loss Orders
Stop-loss orders are essential for defining risk before entering a trade. A stop-loss is an automatic order to sell an asset if it reaches a certain price. In accumulation setups, traders typically place stop-losses just below the support level of the trading range. If the price breaks this support, it invalidates the accumulation thesis, and the trader exits to protect capital.
During distribution, short sellers place stop-losses above the resistance level. If the price breaks out to new highs, the distribution view is proven wrong. Moving stop-losses is also important. As the market moves in the trader's favor (e.g., during the markup phase), the stop-loss can be raised to lock in profits. This is often done by trailing the stop below key moving averages or recent swing lows.
Managing Emotions and Psychology
Market cycles are driven by human psychology—fear, greed, hope, and despair. Recognizing these emotions in the broad market is vital, but managing one's own emotions is equally important. The fear of missing out (FOMO) often strikes during the late stages of a markup phase or distribution, tempting traders to buy at the top. Conversely, panic often leads to selling at the bottom of an accumulation phase.
To combat this, traders rely on objective data rather than feelings. Sticking to a trading plan that defines entry and exit criteria helps remove emotion from the equation. Tools like the "Fear and Greed Index" can also provide a contrarian view. When the market is in extreme greed, it may be time to look for distribution signs. When in extreme fear, accumulation may be underway.
Conclusion
Understanding market cycles through the lens of accumulation and distribution provides a robust framework for navigating the cryptocurrency landscape. By accepting that markets move in identifiable phases rather than random walks, traders can align themselves with the "smart money" and institutional flows. This methodology shifts the focus from reacting to every minor price tick to understanding the broader narrative of supply and demand playing out on the charts.
Successful application involves synthesizing multiple technical tools. Price action reveals the immediate struggle, volume confirms the conviction behind moves, and momentum indicators provide early warnings of trend exhaustion. Whether identifying the quiet building of positions in accumulation or spotting the deceptive volatility of distribution, these tools offer a roadmap for decision-making.
Ultimately, no method guarantees success in every trade. However, combining cycle analysis with strict risk management strategies, such as position sizing and stop-losses, significantly improves the odds. Markets will always cycle between balance and imbalance. The trader's job is to identify the current phase, wait for the appropriate signals, and execute with discipline.
Consistency comes from patiently waiting for the market to reveal its hand through volume and price action.