
Analiza tržišta kriptovaluta često se čini kao navigacija kroz kaotično okruženje u kojem se cijene kreću nasumično. Međutim, iskusni trgovci razumiju da tržišta upravljaju dinamikom ponude i potražnje koju pokreću institucionalni sudionici. Ovaj strukturni pristup analizi oslanja se na identifikaciju ponavljajućih obrazaca poznatih kao tržišni ciklus. Jedan od najpoštovanijih okvira za tumačenje ovih ciklusa je Wyckoffova metodologija. Ovaj pristup fokusira se na odnos između akcije cijene, volumena i vremena kako bi se odredio vjerojatan budući smjer imovine.
U srži ove metodologije nalazi se koncept da tržišta ne kreću ravnomjerno. Umjesto toga, prelaze između faza ravnoteže i neravnoteže. Veliki sudionici na tržištu, često nazvani „pametni novac“ ili institucionalni investitori, ne mogu ulaziti ili izlaziti iz pozicija trenutno bez narušavanja cijene. Stoga moraju polako graditi pozicije tijekom određenih razdoblja ili postupno prodavati svoje udjele tijekom drugih. Prepoznavanje ovih tragova omogućuje maloprodajnim trgovcima da usklade svoje strategije s dominantnim tržišnim silama umjesto da se bore protiv njih.
Uspješna primjena ove metode zahtijeva duboko razumijevanje čitanja grafikona i tehničkih indikatora. Ovladavanjem analizom trendova cijena, volumena trgovanja i momenta, investitori mogu uočiti suptilne znakove akumulacije i distribucije. Ovaj vodič istražuje fundamentalne mehanizme ovih ciklusa. Detaljno objašnjava kako koristiti tehničke alate za identifikaciju trenutaka kada pametni novac kupuje ili prodaje.

The Core Components of Market Analysis
Analyzing Price Action Through Charts
The first step in identifying market cycles is understanding how price data is visualized. Charts provide a historical record of asset performance, and different types of charts offer varied perspectives. Line charts connect closing prices over a set period. They offer a clean, simple view of the overall trend but lack detailed information about price behavior within specific intervals. This makes them useful for seeing the "big picture" of a market cycle but less effective for spotting precise entry points.
Candlestick charts are the preferred tool for detailed cycle analysis. Each candlestick displays the open, high, low, and close prices for a specific timeframe. The body of the candle shows the difference between the open and close, while the wicks indicate the extreme highs and lows. This structure reveals the struggle between buyers and sellers. For instance, a long lower wick suggests that sellers pushed the price down, but buyers stepped in to push it back up. This often signals support during an accumulation phase.
The Critical Role of Trading Volume
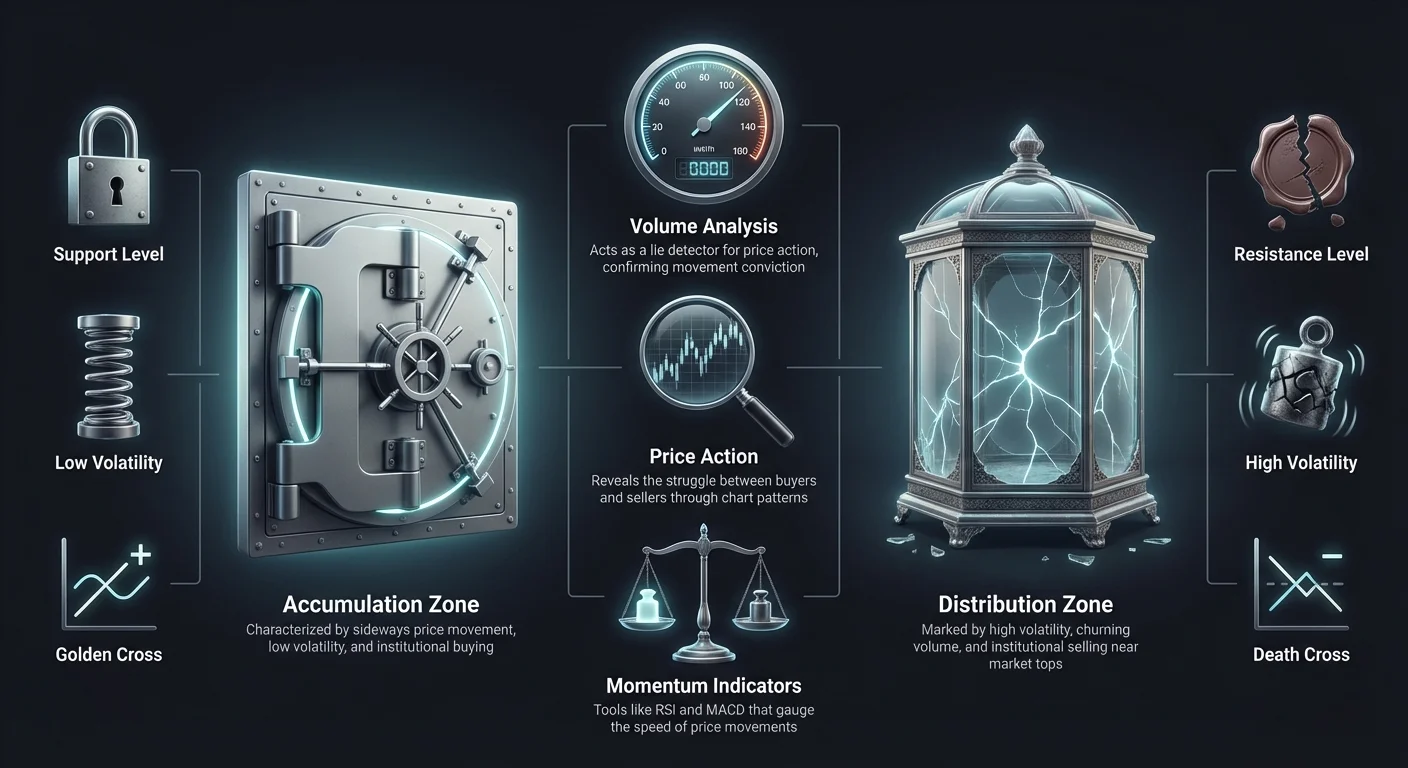
Price action alone tells only half the story. Trading volume provides the necessary context to validate price movements. Volume represents the total amount of an asset traded during a specific period. In the context of market cycles, volume acts as a lie detector for price action. A significant price movement accompanied by high volume indicates strong conviction from market participants. This confirms that the trend is valid and likely to continue.
Conversely, price movements on low volume suggest a lack of interest or conviction. If a price breaks out of a range but volume remains low, it may be a "trap" or a false breakout. Institutional traders often use periods of high volume to mask their activities. For example, they may sell into a rising market (distribution) or buy into a falling market (accumulation). Monitoring volume anomalies helps traders spot when the "smart money" is active, even if the price hasn't moved significantly yet.
Volatility and Market Sentiment
Volatility measures the speed and extent of price changes. It is a key characteristic used to distinguish between different cycle phases. High volatility is often associated with uncertainty and emotional trading. This is frequently seen during the end of a distribution phase or the panic of a market crash. During these times, prices swing wildly as fear and greed dominate investor behavior.
Low volatility, on the other hand, often characterizes the accumulation phase. As the market settles and institutional investors quietly build positions, price ranges tighten. This period of calm often precedes a significant expansion in price. Understanding volatility helps traders manage their expectations and risk. It also aids in identifying the psychological state of the market, providing clues about whether the cycle is nearing a turning point.
Understanding the Market Cycle Phases
The Accumulation Phase
The accumulation phase occurs after a downtrend when the selling pressure begins to dissipate. During this period, the asset is often considered undervalued. Institutional investors and "smart money" begin to buy the asset gradually to avoid spiking the price. This phase is characterized by sideways price movement, often referred to as a trading range or consolidation. The general public is usually bearish or indifferent during this time, having lost interest due to the preceding price decline.
Identifying accumulation requires patience. Traders look for specific signs such as a decrease in volatility and volume patterns that support buying. While the price moves horizontally, volume often increases on up-moves and decreases on down-moves. This subtle shift indicates that demand is slowly overcoming supply. The goal during accumulation is to position oneself before the markup phase begins, capturing the subsequent trend from its early stages.
The Markup and Markdown Phases
Once the available supply has been absorbed during accumulation, the price is ready to move. This leads to the markup phase, commonly known as a bull market. During this phase, demand exceeds supply, and the price trends upward. Technical indicators like the Golden Cross, where a short-term moving average crosses above a long-term one, often confirm the start of this phase. Traders observe higher highs and higher lows, supported by increasing volume on rallies.
Eventually, the trend reaches a point of exhaustion, leading to distribution. Following distribution, the market enters the markdown phase, or bear market. Supply exceeds demand, and the price declines. This phase is confirmed by signals such as the Death Cross, where a short-term moving average crosses below a long-term one. Identifying the transition from markup to distribution, and eventually to markdown, is crucial for preserving capital and avoiding large losses.
The Distribution Phase
Distribution is the counterpart to accumulation. It occurs after an extended uptrend when the asset is overvalued. Smart money uses the strong buying demand from retail investors to offload their large positions. Like accumulation, distribution often takes place within a sideways trading range. However, the characteristics are different. Volatility tends to be high, with sharp price swings that lure retail traders into thinking the uptrend will continue.
During distribution, volume analysis becomes critical. Traders often see high volume without significant price progress, known as "churning." This indicates that despite strong buying effort, aggressive selling is absorbing the demand. Price patterns may show signs of weakness, such as lower highs or failure to break resistance. Recognizing distribution allows traders to exit positions and lock in profits before the markdown phase begins.
Technical Tools for Identifying Cycles
Moving Averages and Crossovers
Moving averages (MAs) are essential tools for smoothing out price data to identify the underlying trend. They are particularly useful for confirming cycle transitions. The most common MAs used are the 50-day and 200-day simple moving averages. These indicators lag behind price, meaning they confirm a trend rather than predict it. However, their reliability makes them a staple in cycle analysis.
The interaction between these two moving averages provides powerful signals. A Golden Cross occurs when the 50-day MA crosses above the 200-day MA. This signals that short-term momentum is outpacing the long-term average, often marking the transition from accumulation to a markup phase. Conversely, a Death Cross occurs when the 50-day MA crosses below the 200-day MA. This warns that the long-term trend is turning bearish, signaling the potential start of a markdown phase.
Momentum Oscillators
Momentum oscillators help traders gauge the speed of price movements and identify overextended conditions. The Relative Strength Index (RSI) is a popular tool that measures the magnitude of recent price changes. It ranges from 0 to 100. An RSI above 70 generally indicates an overbought condition, common during distribution. An RSI below 30 suggests an oversold condition, often seen during accumulation.
The Stochastic Oscillator is another valuable indicator. It compares a closing price to its price range over a specific period. Like the RSI, it helps identify potential reversal points. When the Stochastic lines cross in overbought or oversold territory, it can signal a shift in momentum. These tools are most effective when used to confirm observations from price action and volume, rather than as standalone buy or sell signals.
Advanced Cycle Indicators
For more precise analysis, traders may use specialized indicators like the Pi Cycle Top. This tool uses specific moving average combinations to identify potential market peaks. Historically, it has been effective in signaling the top of Bitcoin market cycles. By comparing short-term and long-term trends, it highlights moments when the market is significantly overheated.
Another useful tool is the Moving Average Convergence Divergence (MACD). This indicator tracks the relationship between two moving averages of a price. The MACD consists of a MACD line, a signal line, and a histogram. Crossovers between the MACD line and the signal line indicate shifts in momentum. Divergences between the MACD and price are particularly powerful. For example, if the price makes a new high but the MACD does not, it suggests weakening momentum, a common sign of distribution.
Analyzing Accumulation in Detail
Price Action Characteristics
During the accumulation phase, price action is defined by a battle between lingering supply and growing demand. The price typically moves within a defined horizontal range, bounded by support and resistance levels. The support level represents the price at which buyers see value and step in to purchase. The resistance level is where sellers are still active. This range-bound movement can last for weeks or even months.
Candlestick patterns play a vital role in spotting accumulation. Traders look for bullish reversal patterns near the support level. A Hammer candle, for instance, shows that sellers pushed the price down, but buyers returned with strength to close near the open. This indicates rejection of lower prices. Similarly, a Bullish Engulfing pattern suggests that buying pressure has overwhelmed selling pressure. These patterns, appearing repeatedly at support, reinforce the validity of the accumulation zone.
Volume Signatures
Volume analysis distinguishes genuine accumulation from a mere pause in a downtrend. In an ideal accumulation schematic, volume should diminish as the trading range develops. This indicates that the selling pressure is drying up. As the phase progresses, traders look for localized spikes in volume on upward price moves. This suggests that institutional buyers are aggressively stepping in.
Conversely, volume on downward moves toward the support level should be light. If the price drops to support on heavy volume, it suggests that supply is still dominant, and the support may fail. The "Spring" is a classic accumulation concept where price briefly breaks below support on low volume, shaking out weak hands, before quickly reclaiming the range. This final test of supply often precedes the breakout into the markup phase.
| Feature | Accumulation Phase | Distribution Phase |
|---|---|---|
| Trend Context | Follows a downtrend | Follows an uptrend |
| Volume Trend | Increases on rallies | Increases on declines |
| Volatility | Low / Decreasing | High / Increasing |
Confirmation Signals
Confirming the end of accumulation is crucial to avoid entering a trade too early (dead money) or too late (chasing). A decisive breakout above the resistance level of the trading range is the primary confirmation. This breakout should be accompanied by a significant surge in volume. High volume proves that the breakout is backed by smart money and is not a false move.
Retests of the breakout level also offer confirmation. After breaking resistance, the price often pulls back to test the level as new support. If this pullback occurs on low volume and holds, it validates the transition to the markup phase. Additionally, momentum indicators like the RSI should move into bullish territory (above 50 or 60) and stay there, reflecting the sustained strength of the new trend.
Detaljna analiza distribucije
Otkrivanje slabosti na vrhu
Faze distribucije često su zavaravajuće jer se događaju dok je opći sentiment još uvijek euforičan. Cijena može nastaviti praviti nove visine, ali kvaliteta trenda se pogoršava. Ovaj fenomen poznat je kao divergencija. Akcija cijene postaje prekinuta i preklapajuća, signalizirajući da je glatki uzlazni momentum nestao. Institucije prodaju u snagu kupovine, ograničavajući daljnje dobitke.
Obrasci svijeća na vrhu raspona pružaju rane upozorenja. Svijeća Shooting Star, koja ima malo tijelo i dugi gornji fitilj, ukazuje da su kupci gurnuli cijenu gore, ali su prodavači natjerali natrag dolje. Ovo odbijanje viših cijena je zaštitni znak distribucije. Bearish Engulfing obrasci i velike crvene svijeće s malo ili bez donjih fitila također signaliziraju da prodavači preuzimaju kontrolu nad tržištem.
Upozorenja volumena
Ponašanje volumena u distribuciji je inverzno od akumulacije. Trgovci bi trebali paziti na „spikeove ponude“ – dane s visokim volumenom, ali malo aprecijacije cijene ili čak padovima cijene. To sugerira da velike prodajne naložbe apsorbiraju sav kupovni interes. Ako cijena napravi novu visinu, ali volumen je niži nego na prethodnim visinama, to ukazuje na nedostatak institucionalnog sudjelovanja.
Još jedan znak upozorenja je visok volumen na danima pada ili probojima manjih razina podrške unutar raspona. To pokazuje da su prodavači agresivni. „Upthrust“ je uobičajeni događaj distribucije gdje cijena nakratko probije iznad otpora uz niži volumen, mameći maloprodajne kupce, prije nego što oštro reverzira natrag u raspon. Ova zamka zaključava kasne kupce koji će biti prisiljeni prodati kako cijena pada.
Potvrda markdowna
Prijelaz od distribucije do faze markdowna potvrđuje se kada cijena probije ispod razine podrške trgovačkog raspona. Poput proboja akumulacije, ovaj proboj dolje trebao bi biti podržan visokim volumenom, ukazujući na žurbu za izlazak. Kada se ova podrška probije, često djeluje kao otpor u budućnosti.
Tehnički indikatori pojačavaju ovaj medvjeđi pomak. MACD može pokazati medvjeđe križanje ili divergenciju, gdje momentum pada unatoč visinama cijena. RSI može ne uspjeti dosegnuti razine prekupljenosti na rallyjima i početi padati ispod 40 ili 30. Konačno, Death Cross na pomičnim prosjecima pruža konačnu zaostalu potvrdu da se dugoročni trend pomaknuo od bikovskog do medvjeđeg.
Upravljanje rizicima u trgovanju ciklusima
Strategijsko dimenzioniranje pozicija
Trgovanje na temelju tržišnih ciklusa zahtijeva disciplinizirano upravljanje rizicima. Čak i najbolja analiza ne može garantirati specifičan ishod. Dimenzioniranje pozicija je praksa dodjele samo određenog postotka portfelja jednoj trgovini. To osigurava da neuspjeli setup ne uzrokuje katastrofalnu štetu ukupnom računu.
U kontekstu akumulacije, trgovci mogu započeti s manjom „pilot“ pozicijom kako se raspon razvija. Zatim mogu dodati poziciji kako se pojavljuju signali potvrde, poput proboja visokog volumena ili uspješnog retesta. Ova tehnika, poznata kao pyramiding, omogućuje trgovcima maksimizirati izloženost kada je vjerojatnost uspjeha najveća, dok minimiziraju rizik tijekom nesigurnog razdoblja konsolidacije.
Korištenje stop-loss naložbi
Stop-loss naložbe su ključne za definiranje rizika prije ulaska u trgovinu. Stop-loss je automatski nalog za prodaju imovine ako dosegne određenu cijenu. U setupovima akumulacije, trgovci tipično postavljaju stop-lossove tik ispod razine podrške trgovačkog raspona. Ako cijena probije ovu podršku, to poništava tezu akumulacije, a trgovac izlazi kako bi zaštitio kapital.
Tijekom distribucije, short selleri postavljaju stop-lossove iznad razine otpora. Ako cijena probije do novih visina, distribucijski pogled je dokazan pogrešnim. Pomicanje stop-lossova je također važno. Kako tržište ide u korist trgovca (npr. tijekom faze markupa), stop-loss se može podići kako bi se zaključali profiti. To se često radi praćenjem stopa ispod ključnih pomičnih prosjeka ili nedavnih swing lowova.
Upravljanje emocijama i psihologijom
Tržišni ciklus pokreće ljudska psihologija – strah, pohlepa, nada i očaj. Prepoznavanje ovih emocija na širem tržištu je vitalno, ali upravljanje vlastitim emocijama je jednako važno. Strah od propuštanja (FOMO) često pogađa tijekom kasnih stadija faze markupa ili distribucije, mameći trgovce na kupnju na vrhu. Naprotiv, panika često vodi prodaji na dnu faze akumulacije.
Kako bismo se borili protiv toga, trgovci se oslanjaju na objektivne podatke umjesto osjećaja. Držanje se trgovačkog plana koji definira kriterije ulaska i izlaska pomaže ukloniti emocije iz jednadžbe. Alati poput „Fear and Greed Indexa“ mogu također pružiti kontrarijanski pogled. Kada je tržište u ekstremnoj pohlepi, može biti vrijeme tražiti znakove distribucije. Kada je u ekstremnom strahu, akumulacija može biti u tijeku.
Zaključak
Razumijevanje tržišnih ciklusa kroz prizmu akumulacije i distribucije pruža robusni okvir za navigaciju kroz krajolik kriptovaluta. Prihvaćanjem da tržišta kreću u identificiranim fazama umjesto nasumičnih šetnji, trgovci se mogu uskladiti s „pametnim novcem“ i institucionalnim tokovima. Ova metodologija pomiče fokus s reagiranja na svaki manji tick cijene na razumijevanje šire priče ponude i potražnje koja se odvija na grafikonima.
Uspješna primjena uključuje sintezu više tehničkih alata. Akcija cijene otkriva trenutnu borbu, volumen potvrđuje uvjerenost iza poteza, a indikatori momenta pružaju rana upozorenja o iscrpljenju trenda. Bilo da identificiramo tiho grade pozicija u akumulaciji ili uočavamo zavaravajuću volatilnost distribucije, ovi alati nude putokaz za donošenje odluka.
Konačno, nijedan metod ne garantira uspjeh u svakoj trgovini. Međutim, kombiniranje analize ciklusa s strogim strategijama upravljanja rizicima, poput dimenzioniranja pozicija i stop-lossova, značajno poboljšava šanse. Tržišta će uvijek ciklusirati između ravnoteže i neravnoteže. Posao trgovca je identificirati trenutnu fazu, čekati odgovarajuće signale i izvršavati s disciplinom.
Dosljednost dolazi iz strpljivog čekanja da tržište otkrije svoju ruku kroz volumen i akciju cijene.