In the fast-paced and often volatile environment of cryptocurrency markets, price charts represent more than just lines and bars. They serve as a historical record of human emotion, capturing the constant tug-of-war between optimism and fear. Every data point on a chart tells a story of buyers and sellers clashing for dominance. Among the most powerful narrative tools in a trader's arsenal are the wicks and shadows attached to candlesticks. These thin lines often hold the key to understanding where value has been rejected and where the market intends to go next.
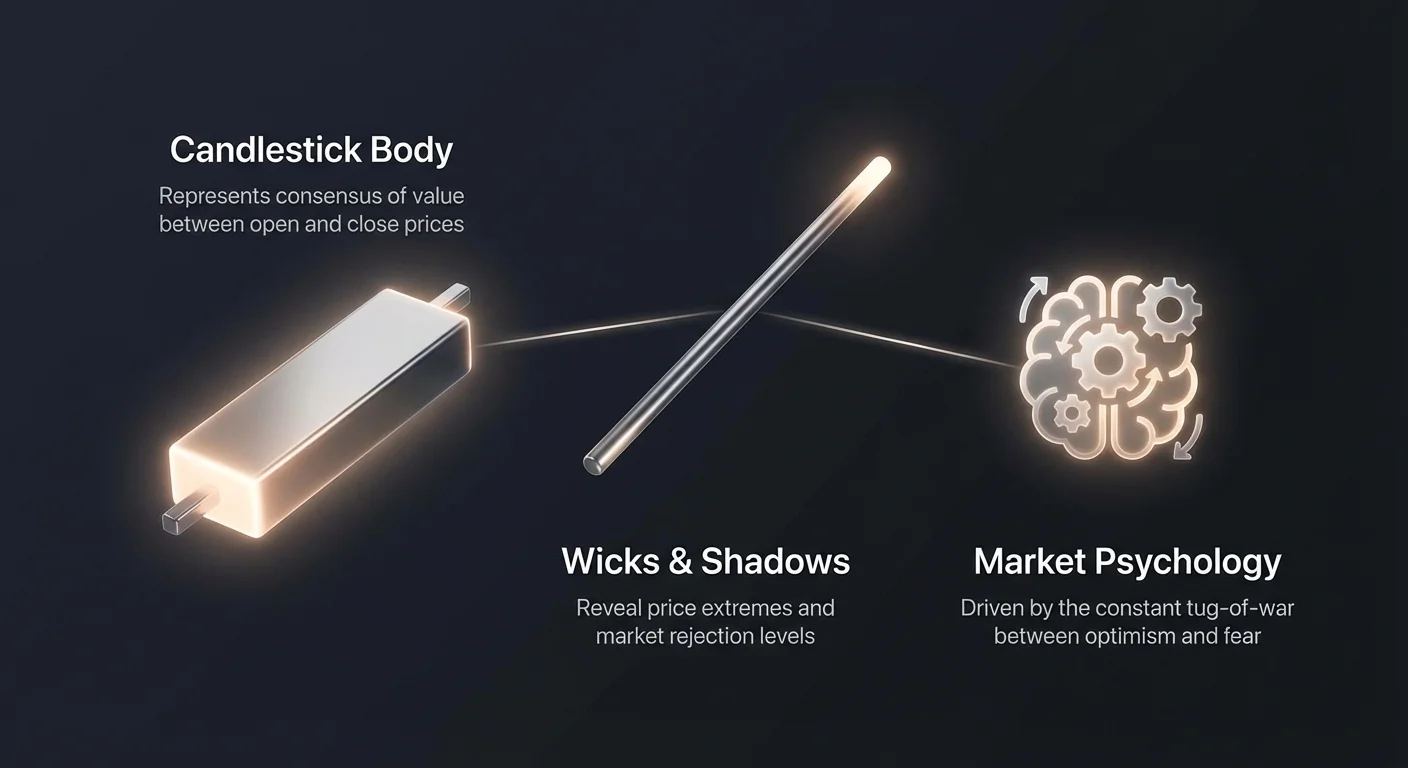
Understanding the anatomy of a candlestick is the first step toward decoding these signals. While the body of the candle shows the open and close prices, representing the consensus of value for that timeframe, the wicks reveal the extremes. They show how far buyers or sellers attempted to push the price before being forced back. A long wick is not merely a visual quirk. It is definitive proof that a specific price level was tested and subsequently rejected by the market participants.
This rejection is often the first sign of a reversal. When price pushes deep into a new high or low but fails to sustain that level by the time the candle closes, it indicates exhaustion. The momentum that drove the price to that extreme has faded, and the opposing force has stepped in to reclaim control. By mastering the interpretation of these extreme price rejections, traders can identify high-probability setups that others might miss.
The Psychology of Market Rejection
To trade wicks effectively, one must understand the psychology driving their formation. A long shadow indicates a failure of one side of the market to maintain control. If a candle has a long upper wick, it means buyers were aggressive early in the session. They pushed prices higher, likely triggering fear of missing out among novice traders. However, smart money or heavy supply zones stepped in, selling into that strength and driving the price back down.
Conversely, a long lower wick tells a story of failed capitulation. Sellers attempted to drive the market into the ground, perhaps triggering stop-losses or panic selling. Yet, by the end of the period, value buyers stepped in to absorb that liquidity. They pushed the price back up, leaving behind a "tail" that serves as evidence of strong demand.
These visual footprints allow traders to spot potential turning points before a full trend reversal becomes obvious to the general public. It moves analysis beyond simple trend following and into the realm of anticipating market sentiment shifts. The wick is the footprint of a battle where one side lost significant ground.
The Rising Bullish Hammer: Identifying the Bottom
The rising hammer, often simply called the bullish hammer, is one of the most iconic single-candle patterns in technical analysis. It is a classic signal that appears at the bottom of a sustained downtrend, suggesting that the bearish momentum is running out of steam. Its unique shape resembles a hammer, consisting of a small body at the top of the range and a long lower wick trailing beneath it.
For a candlestick to qualify as a valid rising hammer, it must meet specific structural criteria. The lower wick should be at least two to three times the length of the candle's body. This proportion is critical because it quantifies the severity of the rejection. A short wick suggests only mild buying interest, whereas a long wick demonstrates a violent rejection of lower prices.
Analyzing the Hammer's Narrative
The narrative behind the hammer is one of initial failure followed by resurgence. The session likely opened with bears continuing the downtrend, pushing prices significantly lower. During this phase, the market sentiment is overwhelmingly negative. However, at a specific low point, the selling pressure evaporates.
Buyers recognize the asset is oversold or has hit a key support level. They aggressively enter the market, driving the price all the way back up near the opening level. If the candle closes green (above the open), it indicates that buyers not only absorbed the selling but pushed price net positive for the period. This creates a strong psychological pivot point.
Confirmation and Context
Identifying a hammer is only the first step. A common mistake is entering a trade immediately upon seeing the pattern. In cryptocurrency markets, distinct trends can persist longer than expected. Therefore, confirmation is essential. Traders typically wait for the next candle to close higher than the hammer's high to validate the reversal.
Context is equally vital. A hammer forming in the middle of a sideways range is often just noise. However, a hammer forming after a steep sell-off, specifically near a known support zone or historical low, carries significant weight. Volume analysis also plays a role here; a hammer accompanied by a spike in trading volume suggests high participation in the reversal, increasing the probability of a successful trade.
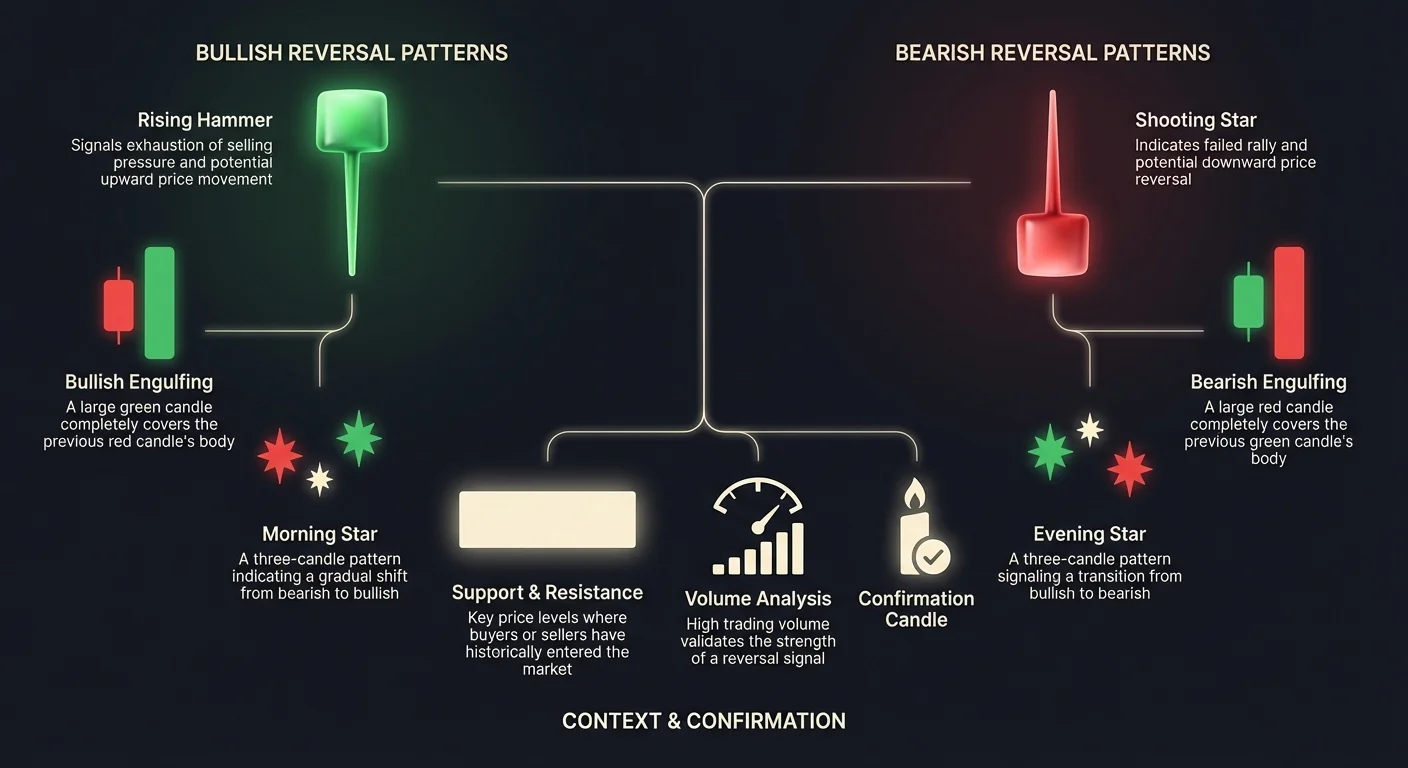
Pucajuća zvijezda: Anticipiranje vrha
Medvjeđi pandan čekiću je Pucajuća zvijezda, ponekad nazvana padajući čekić. Ovaj obrazac se pojavljuje nakon snažnog rastućeg trenda i signalizira da bikski momentum vjerojatno jenjava. Vizualno, izgleda kao obrnuti čekić, s malim tijelom smještenim blizu dna raspona i vrlo dugim gornjim fitiljem koji se proteže prema gore.
Pojavljivanje Pucajuće zvijezde je upozorenje za trgovce koji drže duge pozicije. Sugerira da je uzlazna putanja tržišta naletjela na strop, barem privremeno. Baš kao i čekić, valjanost ovog obrasca uvelike ovisi o duljini fitilja u odnosu na tijelo. Gornja sjena mora biti značajno duža od stvarnog tijela kako bi se potvrdilo snažno odbijanje.
Medvjeđa promjena raspoloženja
Psihologija iza Pucajuće zvijezde pokreće se scenarijem „bikove zamke“. Tijekom formacije svijeće, kupci guraju cijene na nove vrhove, nastavljajući uspostavljeni rastući trend. Optimizam je visok, a kasni ulaznici mogu kupovati očekujući nastavak rallyja.
Međutim, prodavači koriste ove više cijene da isporuče pozicije ili započnu kratke trgovine. Ponuda nadjačava potražnju, prisiljavajući cijenu da se sruši natrag prema razini otvaranja. Do zatvaranja svijeće, bikovi su izgubili sve svoje dnevne dobitke. Dugi gornji fitilj ostaje kao spomenik neuspjelom pokušaju proboja, signalizirajući da je otpor jači nego što se očekivalo.
Trgovanje Pucajućom zvijezdom
Prilikom trgovanja ovim obrascem, strpljenje je vrlina. Pucajuća zvijezda sugerira preokret, ali rastući trend može još uvijek imati preostalu snagu. Konservativni trgovci čekaju da se sljedeća svijeća zatvori ispod tijela Pucajuće zvijezde. To potvrđuje da su medvjedi zadržali kontrolu u sljedeću sesiju.
Stop-lossovi se obično postavljaju tik iznad vrha gornjeg fitilja. Ako cijena probije tu razinu, obrazac je nevaljan, a rastući trend se može nastaviti. Ovaj obrazac je posebno potentan kada se usklađuje s tehničkim indikatorima poput Relativnog indeksa snage (RSI) koji pokazuje prekupljene uvjete.
| Karakteristika | Rastući čekić | Pucajuća zvijezda |
|---|---|---|
| Kontekst trenda | Pojavljuje se nakon padajućeg trenda | Pojavljuje se nakon rastućeg trenda |
| Vizualni oblik | Malo tijelo, dugi donji fitilj | Malo tijelo, dugi gornji fitilj |
| Signal | Bikski preokret (Kupnja) | Medvjeđi preokret (Prodaja) |
Engulfing Patterns: The Power of Momentum Shifts
While hammers and shooting stars rely on wicks to tell the story, engulfing patterns rely on the candle body to demonstrate a total shift in power. These are two-candle formations that signal a reversal based on the overwhelming strength of the second candle relative to the first.
Engulfing patterns are highly regarded because they visually display one side of the market completely overpowering the other. The defining characteristic is that the body of the second candle completely covers, or "engulfs," the body of the previous candle. This signals that the sentiment has shifted 180 degrees within a single trading period.
The Bullish Engulfing Formation
A bullish engulfing pattern appears after a downtrend. The first candle in the formation is red, consistent with the prevailing bearish trend. It reflects continued selling pressure. However, the second candle opens lower than the previous close but then rallies aggressively.
The buying pressure is so intense that the price closes higher than the previous candle's open. Visually, the green bar completely wraps around the previous red bar. This indicates that buyers have not only stopped the decline but have erased the losses of the previous period in one fell swoop.
This pattern is often triggered by a fundamental shift or a reaction to a major support level. For traders, it represents a clear entry signal, as the momentum has decisively swung in favor of the bulls. Placing a stop loss below the low of the engulfing candle provides a clear invalidation point for risk management.
The Bearish Engulfing Formation
Conversely, the bearish engulfing pattern signals the end of an uptrend. It begins with a small green candle, showing that bulls are still eking out gains. The next candle opens higher, often gapping up in traditional markets, but immediately encounters heavy selling.
The bears drive the price down aggressively, closing below the open of the previous green candle. This creates a large red body that swallows the prior bullish move. It tells traders that the buyers have been exhausted and that sellers have seized control of the market direction with conviction.
Trading this pattern involves anticipating a downward move or a deep correction. It is a common signal used to exit long positions to protect profits. When this pattern appears near a resistance level or a psychological price ceiling, the probability of a sustained reversal increases significantly.
The Morning Star: A Three-Stage Reversal
Moving beyond single and dual candle patterns, the Morning Star is a three-candle formation that provides a more detailed roadmap of a trend reversal. It is a bullish pattern that typically occurs at the bottom of a downtrend. Unlike the sudden shock of a hammer or engulfing pattern, the Morning Star reveals a gradual transition of power.
This pattern is favored by many crypto traders because it includes a specific period of market indecision. This "pause" in the trend adds credibility to the subsequent reversal, as it suggests a structural shift rather than just a momentary reaction.
Deconstructing the Three Phases
The first candle in a Morning Star is a long, bearish red candle. This confirms that the bears are still in charge and the downtrend is healthy. Selling pressure is dominant, and price closes near the lows.
The second candle is the critical pivot point. It is a small-bodied candle, often referred to as a "star" or a doji. It can be red or green, but its defining feature is its small size. This candle indicates that the selling pressure has subsided, but buyers haven't yet taken control. The market is in a state of equilibrium or hesitation.
The third candle delivers the confirmation. It is a strong bullish green candle that closes well into the body of the first red candle—ideally above the midpoint. This proves that the indecision of the second candle has resolved in favor of the buyers. The bulls have stepped in with force, launching a new upward trajectory.
Strategy and Placement
The Morning Star is a high-confidence setup when found at support levels. The middle candle represents the "bottoming out" process. Traders often place buy orders as the third candle closes or breaks higher.
Risk management is straightforward with this pattern. The stop loss is typically placed below the lowest point of the middle "star" candle. If price drops below this level, it implies the downtrend is continuing and the reversal has failed. Volume should ideally decrease on the first candle and increase significantly on the third candle, validating the influx of buying power.
Večernja zvijezda: Potvrda vrha
Večernja zvijezda je medvjeđi ekvivalent obrasca Jutarnja zvijezda. Stvara vizualni „vrh“ usponog trenda i signalizira početak potencijalnog pada. Poput svog bikovskog pandana, razvija se tijekom tri sesije, pripovijedajući priču o iscrpljenosti i preokretu.
Ovaj obrazac je posebno koristan na kripto tržištu, gdje parabolični porasti često završavaju razdobljem distribucije prije kolapsa. Večernja zvijezda pomaže trgovcima identificirati ovu fazu distribucije prije nego što počne intenzivna prodaja.
Prelazak od pohlepe do straha
Obrazac počinje velikom zelenom svijećom koja nastavlja uspostavljeni usponi trend. U ovoj fazi je pohlepa vjerojatno visoka, a tržište izgleda snažno. Druga svijeća međutim signalizira zaustavljanje momenta. To je zvijezda s malim tijelom koja se razmakne od prve svijeće (na tržištima koja nisu 24/7) ili jednostavno stoji na visinama s malo kretanja.
Ova mala svijeća predstavlja borbu. Kupci više ne guraju cijenu lako gore, a prodavači počinju upijati narudžbe. Treća svijeća potvrđuje preokret. To je velika crvena svijeća koja se zatvara duboko unutar tijela prve zelene svijeće.
Ova treća svijeća stvara „otok“ kretanja cijene na vrhu, ostavljajući kupce u srednjoj svijeći zarobljene u gubećim pozicijama. Kako ovi zarobljeni kupci žure prodati, silazni moment ubrzava.
Trgovanje probojem dolje
Večernja zvijezda je primarni signal za trgovce na kratko ili za ostvarivanje profita na dugim pozicijama. Završetak treće svijeće je okidač. Neki trgovci čekaju proboj ispod minimuma prve svijeće za dodatnu sigurnost, iako to može rezultirati lošijom cijenom ulaska.
Ovaj obrazac najbolje funkcionira kada se srednja svijeća poklapa s važnom razinom otpora ili zonom Fibonacci proširenja. Ukazuje da je tržište testiralo visinu, pronašlo ravnotežu, a zatim je odbijeno. Ovo strukturno odbijanje često je pouzdanije od šiljka jedne svijeće jer uključuje vrijeme kao faktor – tržište je provelo vrijeme na visinama i odlučilo da ne može ostati tamo.
Uloga podrške i otpora
Dok obrasci svijeća pružaju „što“ i „kada“ trgovine, razine podrške i otpora pružaju „gdje“. Obrazac svijeća signalizira potencijalni potez, ali njegova lokacija na grafu određuje vjerojatnost uspjeha.
Rastući čekić koji se formira u sredini trgovačkog raspona, daleko od bilo kakve povijesne interakcije, uglavnom je besmislen. Može samo predstavljati slučajnu volatilnost. Međutim, isti taj čekić koji se formira točno na trendliniji koja je držala mjesecima je vrhunski signal za kupnju.
Konfluencija u trgovanju
Ovaj koncept se zove konfluencija. To je preklapanje više neovisnih signala za stvaranje jače investicijske teze. Kada se bikski obuhvaćajući obrazac pojavi na horizontalnoj razini podrške, a istovremeno RSI ukazuje na prepodane uvjete, signal je daleko moćniji od bilo kojeg od tih indikatora samostalno.
Fitilji su posebno osjetljivi na ove razine. Dugi fitilj koji probija kroz razinu otpora, ali se zatvara ispod nje, je „lažnjak“. Pokazuje da je cijena nakratko premašila razinu, ali tržište nije prihvatilo novu valorizaciju. To potvrđuje snagu otpora.
Trgovci uvijek trebaju gledati lijevo na grafikon. Je li ova razina cijene djelovala kao pod ili strop u prošlosti? Ako se Jutarnja zvijezda formira na razini koja je prethodno pokrenula rally, povijest se vjerojatno ponoviti. Obrazac svijeća je okidač, ali razina podrške je temelj.
Risk Management and Confirmation
No technical analysis tool is infallible. Candlestick patterns are probabilities, not guarantees. The crypto market is influenced by news, macroeconomic factors, and liquidity shocks that can invalidate even the most perfect technical setup. Therefore, strict risk management is non-negotiable.
Confirmation is the first layer of defense. This usually involves waiting for the candle following the pattern to close in the desired direction. While this might mean entering a trade slightly later and sacrificing a small amount of potential profit, it drastically reduces the rate of "false positives."
Placing Stop Losses
Every trade setup based on candlesticks has a natural invalidation point. For a bullish hammer, the invalidation point is the low of the wick. If price drops below that wick, the support has failed, and the thesis is wrong. There is no reason to stay in the trade.
For engulfing patterns, the stop loss goes below the low (bullish) or above the high (bearish) of the engulfing candle. Adhering to these levels ensures that a failed pattern results in a small, manageable loss rather than a catastrophic portfolio drawdown.
Volume Analysis
Volume acts as the fuel for price movement. A reversal pattern with low volume is suspect. It suggests that there is no real conviction behind the move. Conversely, a reversal pattern accompanied by a massive surge in volume indicates that major players are entering the market.
For example, a Bearish Engulfing candle on high volume suggests that whales or institutions are offloading significant bags. This adds weight to the bearish signal. Always check the volume bars at the bottom of the chart to see if the price action is supported by trading activity.
Zaključak
Savladavanje interpretacije fitilja, sjena i formacija svijeća pruža značajnu prednost na tržištima kriptovaluta. Ovi obrasci nisu proizvoljni crteži; oni su kristalizirani otisci dinamike ponude i potražnje. Od očajničkog odbijanja dna vidljivog u Rastušem čekiću do neuspjelog proboja Pucajuće zvijezde, svaka formacija otkriva pobjednika specifične bitke između bikova i medvjeda.
Međutim, učinkovitost ovih signala uvelike ovisi o disciplini trgovca. Prepoznavanje obrasca je samo polovica bitke. Prava vještina leži u kontekstualizaciji tog obrasca unutar šireg trenda tržišta, potvrđivanju ga volumenom i razinama podrške/otpora te izvođenju trgovine s rigoroznim upravljanjem rizikom. Pucajuća zvijezda na otporu je trgovina; Pucajuća zvijezda u vakuumu je kockanje.
Kombiniranjem trenutnih signala raspoloženja svijeća sa strukturnim kontekstom grafikona, trgovci se mogu udaljiti od reaktivnog, emocionalnog donošenja odluka. Umjesto toga, mogu usvojiti proaktivni pristup, anticipirajući preokrete i pozicionirajući se uz dominantne sile tržišta prije nego što trend postane očit gužvi.
Pravo majstorstvo trgovanja dolazi ne iz predviđanja budućnosti, već iz jasnog prepoznavanja onoga što vam tržište govori u sadašnjosti.