
Understanding the true worth of a cryptocurrency requires moving past simple headlines and digging into the financial architecture of the project. Unlike traditional stocks, where the number of outstanding shares is relatively stable and regulated, the supply of a cryptocurrency token is often highly dynamic, programmed to inflate dramatically over time.
This difference makes conventional valuation metrics unreliable in isolation. Investors who rely solely on Market Capitalization (MC) often miss the looming threat of massive token unlocks scheduled to flood the market, leading to severe price depreciation.
This guide moves beyond the surface level, offering a critical financial analysis of the primary valuation metrics—Market Cap and Fully Diluted Valuation (FDV). We will explore how these metrics are calculated, why they often fail to capture the whole picture, and how the critical gap between them serves as a vital signal of a project’s future inflation risk and long-term viability. By the end, you will possess the tools necessary for proper investor due diligence, ensuring you look past the immediate price and analyze the full scope of a crypto asset’s tokenomics.
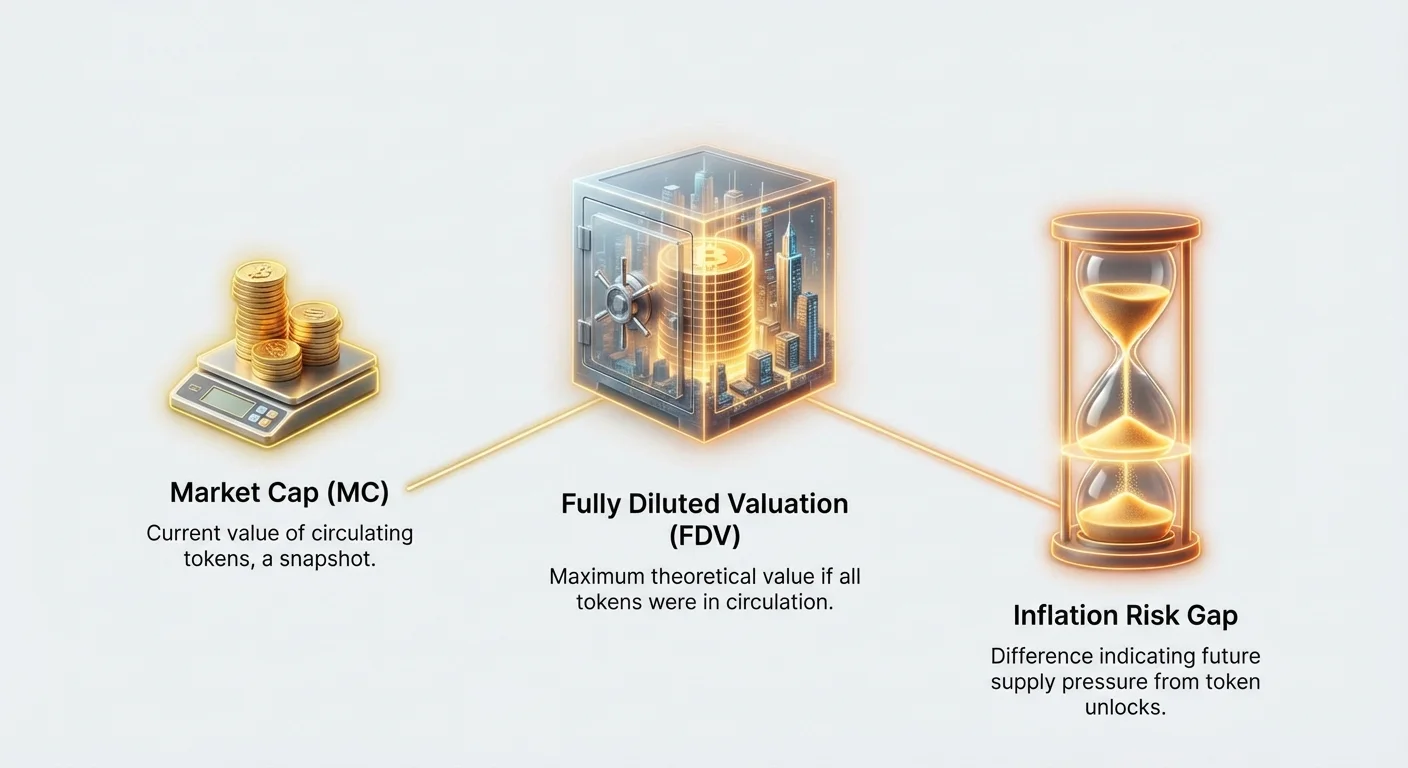
The Standard Snapshot: Market Capitalization (MC)
Market Capitalization (MC) is the most commonly cited metric used to gauge the size of a cryptocurrency project. It provides a simple, instantaneous snapshot of a project's value at the current moment.
Calculating Market Cap
The calculation for Market Capitalization is straightforward:
- Current Price: The price at which the asset is currently trading.
- Circulating Supply: The total number of tokens currently available to the public and actively being traded on the market.
For example, if Project Alpha’s token is trading at $1.00 and there are 100 million tokens actively circulating, its Market Cap is $100 million. This metric is useful for comparison, allowing investors to quickly categorize assets as "large-cap" (e.g., Bitcoin, Ethereum), "mid-cap," or "small-cap."
The Flaw of Illiquidity and Concentration
While easy to calculate, Market Cap is inherently flawed as a standalone valuation tool in the crypto space, primarily due to issues of illiquidity and supply concentration.
The Illusion of Instant Sell-Off
Market Cap assumes that every token in the circulating supply could be sold instantly at the current market price. In reality, if a significant holder attempted to sell even 1% of the circulating supply, the resulting selling pressure would drastically drive the price down, proving the Market Cap was inflated relative to the actual liquid funds available.
This is especially true for newer, smaller projects, which often have low trading volume. If a project has an MC of $50 million but only $100,000 in daily trading volume, it signifies low liquidity. Any substantial buy or sell order (a "whale trade") will severely impact the price, meaning the stated $50 million valuation is highly theoretical.
Concentrated Supply Risk
In many early-stage crypto projects, the circulating supply is not evenly distributed. A large portion might be held by the project founders, venture capitalists (VCs), or early investors. Even if these tokens are officially "circulating," they may be subject to internal agreements or social consensus to not be sold immediately.
If VCs or founding teams hold a massive percentage of the circulating supply, a sudden decision to liquidate their holdings can trigger a market crash far more severe than the Market Cap might suggest. The true risk is not just the size of the circulating supply, but who holds it and when they are likely to sell.

The Long-Term Ceiling: Fully Diluted Valuation (FDV)
If Market Cap is a snapshot of the present, Fully Diluted Valuation (FDV) is the view of the project’s maximum potential size, assuming all future tokens are released. FDV provides a critical context by accounting for the project's entire programmed supply, whether those tokens exist today or are scheduled for release decades from now.
Calculating Fully Diluted Valuation
FDV is calculated using the total maximum possible supply:
- Maximum Total Supply: The absolute highest number of tokens that will ever exist under the project's tokenomics design. (For Bitcoin, this is 21 million).
Returning to Project Alpha: if the price remains $1.00, but the maximum total supply is 1 billion tokens (instead of the current 100 million circulating), the FDV is $1 billion.
The Purpose of Calculating the Ceiling
Why does an investor care about a valuation that might not be reached for ten years? FDV serves two vital functions in due diligence: comparison and risk assessment.
Comparing Apples to Apples
FDV allows investors to compare nascent projects to established, high-cap competitors on a level playing field.
Imagine a new Layer-1 blockchain (Project X) has a Market Cap of $500 million and 10% of its tokens are circulating. An established competitor (Project Y), like Solana or Avalanche, might have an MC of $20 billion with 90% of its tokens circulating.
If you calculate Project X's FDV, and it turns out to be $5 billion, it appears cheap compared to Project Y. However, if Project X’s FDV is $50 billion, it means the market believes Project X will eventually be valued more highly than the established Project Y, even though X has negligible adoption today. FDV forces the investor to justify that immense valuation premium relative to existing, proven infrastructure.
Measuring Maximum Downside Risk
FDV clearly outlines the maximum potential dilution facing existing investors. It sets the absolute financial ceiling. If a token is trading at a high price today, resulting in a sky-high FDV, the project must demonstrate extremely robust adoption and utility to justify the hundreds of millions or billions of tokens that are guaranteed to enter the supply chain. If the project's FDV is $100 billion, it is effectively saying, "We expect to be one of the largest financial entities in the world." If that scale of ambition is not matched by real-world technology and adoption, the current price is likely unsustainable.
The Critical Gap: Analyzing FDV vs. Market Cap
The most important analytical tool for evaluating crypto value is not Market Cap or FDV in isolation, but the relationship between them—the FDV-to-MC ratio. This ratio is the primary indicator of future inflation risk.
The Signal of Inflation Risk
A high FDV/MC ratio signals that the vast majority of the token supply is still locked up and waiting to enter the market. This represents significant potential selling pressure and future inflation that will likely suppress the price, regardless of positive market sentiment.
- Small Gap (Ratio near 1.0–1.2): Most tokens are already circulating. Future inflation is minimal. Examples: Bitcoin (near 95%+ of max supply is already circulating). The risk is relatively low.
- Medium Gap (Ratio 2.0–5.0): A moderate amount of tokens are pending release, usually tied up in foundations, staking rewards, or long-term vesting schedules. This is common for mature projects that still use token issuance for network incentives.
- Large Gap (Ratio 10.0+): The project is extremely young. Only a small fraction of the total supply is available, meaning 90% or more of the tokens are waiting to be released to the founding team, advisors, and VCs. This signals extreme dilution risk.
Practical Example: The VC Exit Problem
Consider two hypothetical projects in the decentralized social media sector:
| Metric | Project Alpha (New Launch) | Project Beta (Mid-Stage) |
|---|---|---|
| Current Price | $1.00 | $1.00 |
| Circulating Supply | 100 Million | 500 Million |
| Max Total Supply | 1 Billion | 1 Billion |
| Market Cap (MC) | $100 Million | $500 Million |
| Fully Diluted Valuation (FDV) | $1 Billion | $1 Billion |
| FDV/MC Ratio | 10x | 2x |
While both projects share the same eventual ceiling ($1 billion FDV) and the same current token price, an investor in Project Alpha faces five times the inflation risk of an investor in Project Beta.
If Project Alpha sees its next 100 million tokens (the second 10% of supply) released for VCs to sell, the supply immediately doubles, likely necessitating a major price correction to absorb the supply. If the same number of tokens are released in Project Beta, the circulating supply only increases by 20% (from 500M to 600M), making the price impact much less severe.
The large gap in Alpha means that even if the project succeeds, its token holders will have to constantly fight against massive, pre-scheduled inflation driven by the eventual release of the remaining 900 million tokens.
The Engine of Valuation: Tokenomics, Vesting, and Inflation
To understand why the FDV/MC gap exists, we must analyze the project’s tokenomics—the economic model governing the creation, distribution, and destruction of tokens. The key factors influencing future supply are vesting schedules and overall inflation models.
Understanding Vesting and Lock-up Periods
Vesting refers to the contractual mechanism that dictates the slow, scheduled release of tokens to specific groups (founders, VCs, team members, advisors). It prevents these early participants from dumping their entire allocation immediately after the public launch.
The Cliff and the Linear Release
Vesting schedules typically involve two components:
- The Cliff: A period (usually 6 to 12 months) during which no tokens are released, regardless of how long the investor has held them. This period is designed to ensure the founding team and investors are committed long-term before they receive their first payout.
- Linear Release: After the cliff, tokens are typically released continuously on a block-by-block, daily, or monthly basis over a specified duration (e.g., two to four years).
Investors must actively seek out and map these schedules. A common pitfall is investing right before a major "cliff event," which signals the first large unlock of team or VC tokens, often causing significant downward pressure on the token price.
Dissecting Token Allocation
The distribution of the total supply reveals where future selling pressure is likely to originate. A typical distribution might look like this:
- Community/Ecosystem (40%): Released slowly over many years, often through staking rewards or grants. This is generally "healthy inflation" designed to secure or grow the network.
- Founders/Team (20%): High dilution risk, but usually subject to the longest vesting periods (4+ years).
- Seed/VC Investors (20%): High dilution risk, typically shorter vesting periods (1–3 years) after the cliff. This group often has the strongest profit motive for selling quickly once unlocked.
- Treasury/Reserve (10%): Controlled by the project or DAO, used for future development.
- Public Sale (10%): Circulating immediately or shortly after launch.
A thorough due diligence process requires examining the vesting schedule for the largest allocations (Founders and VCs) to predict periods of peak inflation and resulting price volatility.
Inflationary vs. Deflationary Supply Models
The long-term health of the FDV is also dependent on whether the project’s supply model is inflationary or deflationary.
Inflationary Models
These models continually introduce new supply, usually to reward validators, fund development, or incentivize user activity.
- Example: Work Token Systems: Projects where tokens are continuously minted as rewards for participants, like providing liquidity or securing the network. This constant supply pressure requires exponentially increasing demand to maintain or grow the price. The Market Cap will always trend toward the FDV.
Deflationary Models
These models aim to decrease the total circulating supply over time through mechanisms like token burning.
- Example: Fee Burning: Networks that destroy a portion of transaction fees (gas fees). If the amount of fees burned exceeds the amount of new tokens minted (net deflation), the circulating supply shrinks, putting upward pressure on the price. In these cases, the FDV becomes less relevant over time as the true maximum supply is constantly moving lower.
Advanced Due Diligence: Beyond Simple Metrics
While MC and FDV provide necessary context, they only represent mathematical possibilities. True valuation relies on assessing utility, liquidity, and relative market positioning.
The Volume Test: Liquidity and Trading Activity
Liquidity is the most important short-term factor for valuation. High liquidity means the asset can be bought or sold quickly without drastically changing the price. The best way to measure liquidity is through Trading Volume.
Investors should compare a project’s Market Cap against its 24-hour trading volume.
- A healthy, highly liquid asset often has a high Volume-to-MC ratio (e.g., 5% or more). This indicates genuine trading interest and ease of entry/exit.
- A low Volume-to-MC ratio (e.g., less than 0.5%) suggests that the MC is supported by very few transactions. If only a tiny fraction of the market is actively trading, the valuation is fragile and susceptible to manipulation.
Utility and Real-World Adoption
The most expensive pitfall in crypto valuation is falling for high FDVs supported only by hype, rather than fundamental utility. A token only retains value if people need to use it.
Key Questions on Utility:
- Is the token required for core network operations? (E.g., Does the user need the token to pay transaction fees or deposit collateral?)
- Does the token grant governance power? (E.g., Is it used for voting on protocol changes?)
- Is the utility unique and defensible? (E.g., Does the platform offer a function that competing networks cannot easily replicate?)
Without strong utility that generates consistent demand, no tokenomics model—no matter how clever—can prevent the price from plummeting when scheduled inflation hits. Metrics must follow technology; the technology cannot follow metrics.
Context is King: Comparing Peers
The FDV/MC ratio should not be analyzed in isolation. It must be used to compare a project against its closest competitors.
If you are researching three competing DeFi lending protocols, and all have a current Market Cap of $200 million:
- Protocol A: FDV/MC Ratio of 15x.
- Protocol B: FDV/MC Ratio of 4x.
- Protocol C: FDV/MC Ratio of 1.5x.
Assuming all three have similar levels of underlying business activity (Total Value Locked, user count), Protocol A carries significantly more future risk and would likely require exponentially higher adoption to justify the current price relative to Protocol C. Protocol C is a safer bet from a valuation standpoint, as most of its tokens are already priced into the market.
Conclusion
Valuing cryptocurrencies is inherently complex because they combine aspects of technology infrastructure, commodity assets, and corporate equity. To perform sound due diligence, investors must adopt a dual-metric approach.
Market Capitalization provides the current market consensus—the immediate snapshot. Fully Diluted Valuation provides the potential long-term ceiling—the eventual gravitational pull on the price. The analytical gap between these two metrics, fueled by vesting schedules and future inflation, dictates the severity of the dilution risk an investor faces.
Avoid the illusion that a low Market Cap means a token is "cheap." Often, a low MC simply means the inflation clock has barely started ticking. Smart investors look beyond the circulating supply, understand the maximum total supply, map out future token unlocks, and prioritize projects where the high valuation is justified by strong, undeniable utility and robust liquidity, ensuring that demand can absorb the inevitable waves of future supply.