
Successful cryptocurrency trading requires more than just intuition or following the latest news headlines. It demands a systematic approach to understanding market dynamics, price movements, and investor psychology. To navigate the volatile waters of digital assets, traders must master a variety of analytical tools and indicators that provide objective data about market conditions. By combining these tools into a cohesive strategy, investors can filter out noise and identify high-probability trading opportunities.
A comprehensive trading system relies on distinct layers of analysis. This begins with understanding the core value of an asset, moves into decoding visual price history through charts, and culminates in the application of specific technical indicators. These indicators act as the dashboard for a trader, offering signals regarding trend direction, momentum strength, and potential reversal points. Mastering these components transforms trading from a game of chance into a disciplined professional practice.
This guide explores the essential elements of a robust crypto trading system. It covers the foundational pillars of analysis, the art of reading candlestick charts, and the strategic application of advanced indicators. By integrating trend-following tools like moving average crossovers with momentum oscillators like the RSI and MACD, traders can gain a holistic view of the market. This multi-faceted approach allows for better risk management and more informed decision-making in the fast-paced world of crypto.
The Three Pillars of Market Analysis
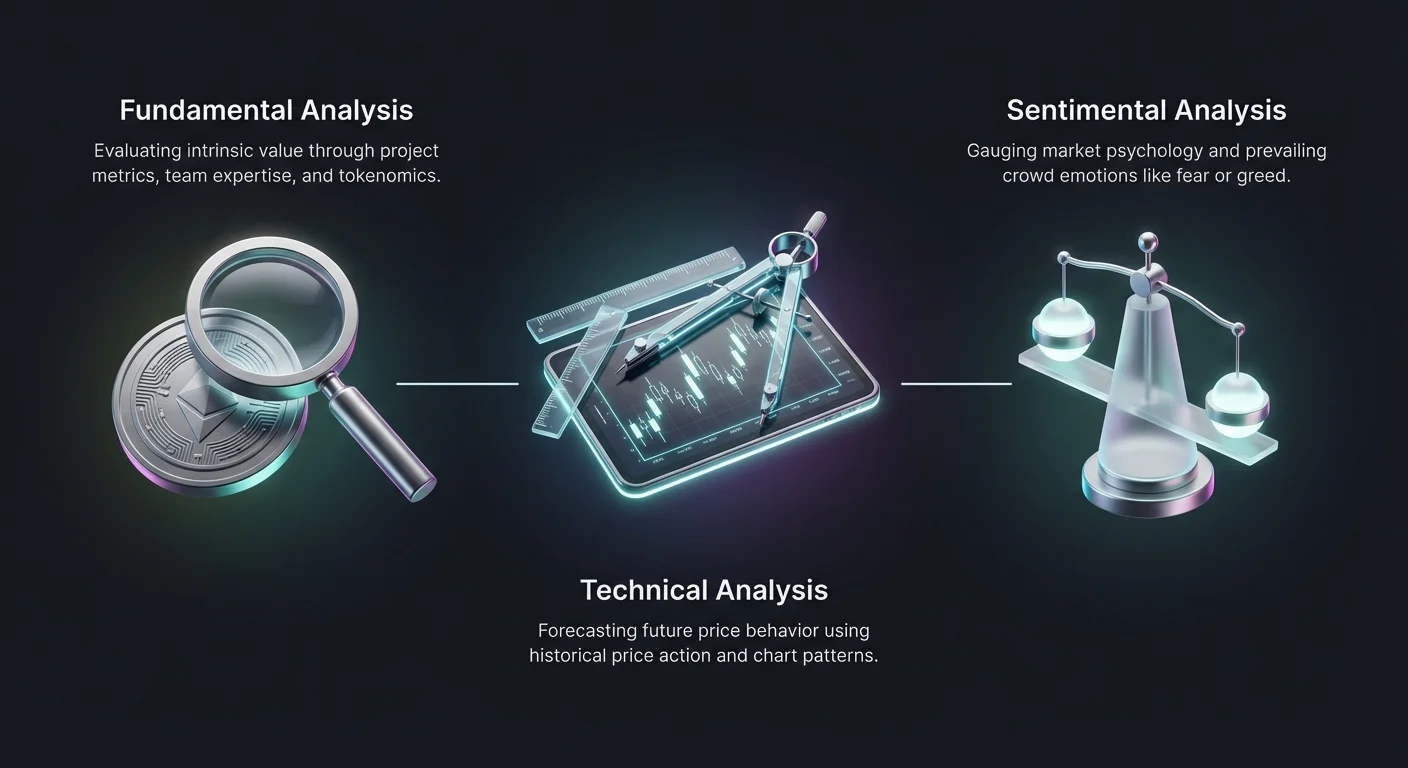
Smart trading decisions are rarely based on a single data point. Instead, they emerge from a triangulation of three distinct analytical approaches: fundamental, technical, and sentimental analysis. Each method provides a unique lens through which to view the market, and combined, they offer a comprehensive picture of an asset's potential.
Fundamental Analysis: Assessing Value
Fundamental analysis focuses on determining an asset's intrinsic value by examining economic and financial factors. In traditional markets, this involves looking at corporate revenue and balance sheets. In the cryptocurrency space, where financial statements often do not exist, the approach shifts to different metrics. Traders evaluate the project's whitepaper, the expertise of the development team, and the utility of the token within its ecosystem.
Adoption rates are a critical component of crypto fundamental analysis. Investors track the growth of active addresses, transaction volumes, and network hash rates to gauge the health of a blockchain. Additionally, "tokenomics"—the supply and demand mechanics of a cryptocurrency—plays a vital role. Understanding factors like halving cycles, total supply caps, and distribution schedules helps traders assess scarcity and long-term value retention.
Technical Analysis: The Study of Price
Technical analysis operates on the principle that historical price action and volume data can predict future market behavior. This method ignores the "why" of a price move and focuses entirely on the "what." Traders use charts to identify recurring patterns and trends that suggest where the price might head next. This involves spotting support and resistance levels, which are price zones where buying or selling pressure historically prevents further movement.
This form of analysis relies heavily on indicators and chart patterns. Tools like moving averages smooth out price data to reveal the underlying trend, while oscillators help gauge the speed of price changes. Technical analysts believe that all known information is already reflected in the price, making the chart the ultimate source of truth for market sentiment and supply-demand dynamics.
Sentimental Analysis: Reading the Crowd
Sentimental analysis attempts to gauge the prevailing mood of the market participants. Since cryptocurrency markets are highly speculative, they are often driven by emotions like fear and greed. Sentimental analysis tracks investor psychology through various channels, including social media discussions, news headlines, and search trends.
Tools like the "Fear and Greed Index" provide a quantitative measure of market emotions. When the market is extremely fearful, it may present a buying opportunity as assets become undervalued. Conversely, extreme greed often signals that the market is overheated and due for a correction. Monitoring "whale" activity—the movement of funds by large holders—also falls under this category, as these massive transactions can shift market perception and price direction.
| Analysis Type | Primary Focus | Key Metrics in Crypto |
|---|---|---|
| Fundamental | Intrinsic Value | Network activity, tokenomics, team |
| Technical | Price Patterns | Charts, volume, moving averages |
| Sentimental | Market Psychology | Social media, Fear & Greed Index, news |
Decoding the Visual Language of Charts
Charts are the canvas upon which technical analysis is performed. They provide a visual history of an asset's price performance over specific timeframes. Understanding how to read these charts is the first step in identifying trends and potential entry or exit points.
Understanding Chart Varieties
Traders utilize different types of charts depending on the level of detail they require. Line charts are the simplest, connecting only the closing prices of each period. They offer a clean, noise-free view of the overall trend, making them ideal for long-term analysis. However, they lack detailed information about what happened within each trading period.
Bar charts provide more data, showing the opening, closing, high, and low prices for each interval. While informative, they can be visually cluttered. This leads most crypto traders to prefer candlestick charts. Candlestick charts display the same data as bar charts but use color-coded "bodies" to represent the movement between open and close prices. This visual format makes it instantly clear whether a specific period was bullish or bearish.
The Anatomy of a Candlestick
A single candlestick tells a detailed story about price action during a set timeframe, whether it is one minute or one month. The thick part of the candle is called the "body," which illustrates the range between the opening and closing prices. If the close is higher than the open, the body is typically green, indicating buying pressure. If the close is lower, the body is red, signaling selling pressure.
Extending from the body are thin lines known as "wicks" or "shadows." These lines represent the highest and lowest prices reached during that period. A long upper wick suggests that buyers pushed the price up, but sellers eventually drove it back down. Conversely, a long lower wick indicates that sellers pushed the price down, but buyers stepped in to recover the level. These visual cues reveal the struggle between bulls and bears.
Identifying Key Patterns
Candlesticks often form recognizable patterns that signal potential future moves. The "Doji" is a common pattern where the open and close prices are virtually identical, resulting in a cross shape. This indicates market indecision and often precedes a trend reversal. Another powerful signal is the "Hammer," which features a small body and a long lower wick, suggesting a potential reversal at the bottom of a downtrend.
Engulfing patterns are also significant. A "Bullish Engulfing" pattern occurs when a large green candle completely overshadows the previous small red candle, signaling that buyers have taken control. The "Morning Star" is a three-candle formation that typically marks the end of a downtrend, consisting of a long red candle, a small indecisive candle, and a long green candle. Recognizing these patterns allows traders to anticipate shifts in market momentum.
Mastering Trend Identification
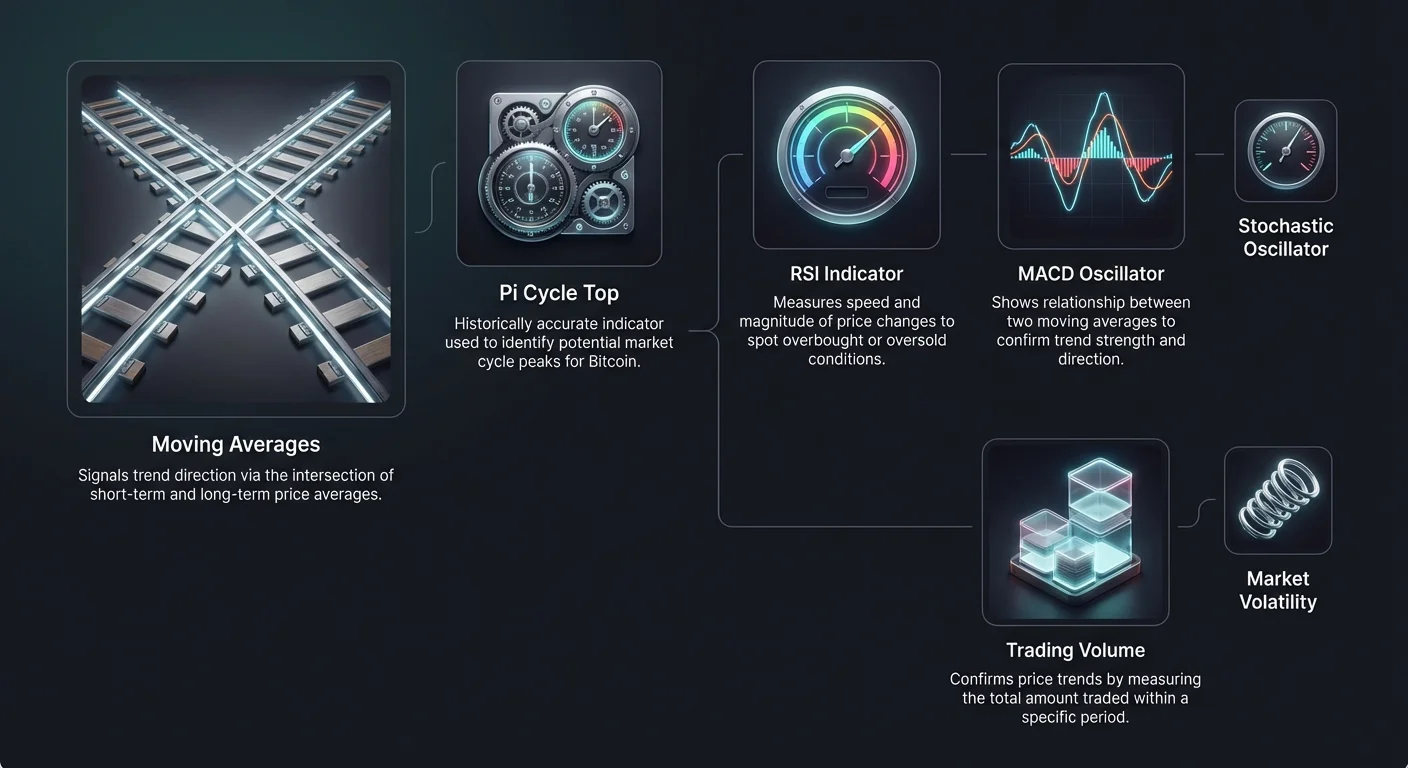
Trend identification is central to profitable trading. Moving averages (MAs) are the primary tools used to smooth out volatile price data and reveal the true direction of the market. By analyzing the interaction between short-term and long-term moving averages, traders can spot major trend reversals.
The Golden Cross
The Golden Cross is a classic bullish signal widely watched by crypto traders. It occurs when a short-term moving average, typically the 50-day MA, crosses above a long-term moving average, usually the 200-day MA. This crossover indicates that short-term momentum is accelerating faster than the long-term average, suggesting the beginning of a sustained uptrend.
Traders view the Golden Cross as a confirmation signal. Before the cross, the 50-day MA lags below the 200-day MA during a downtrend. When it crosses upward, it shifts market sentiment, often leading to the 200-day MA becoming a new support level. Traders often use this signal to enter long positions, placing stop-loss orders just below the moving averages to manage risk.
The Bearish or Death Cross
The opposite of the Golden Cross is the Bearish Cross, often ominously referred to as the Death Cross. This pattern forms when the 50-day moving average crosses below the 200-day moving average. It signifies that short-term momentum is deteriorating and that the market may be entering a long-term bearish phase.
Like its bullish counterpart, the Death Cross is a lagging indicator. It confirms a trend change that has effectively already begun. However, it remains a powerful warning sign. When this cross occurs, especially if accompanied by high selling volume, it suggests that the asset has moved from an accumulation phase to a distribution phase. Traders use this signal to reduce exposure or tighten their risk management strategies.
The Pi Cycle Top Indicator
For Bitcoin specifically, the Pi Cycle Top indicator has proven to be a historically accurate tool for identifying market cycle peaks. This indicator uses two specific moving averages: the 111-day simple moving average (SMA) and a multiple of the 350-day SMA (specifically, the 350-day SMA multiplied by two).
A "top" signal is generated when the 111-day SMA crosses above the 2 x 350-day SMA. Historically, this crossover has occurred within days of Bitcoin's absolute price peak in previous bull markets. It signals that the price has accelerated too far beyond its long-term trend and is likely overheated. While no indicator is perfect, the Pi Cycle Top helps long-term investors identify high-probability zones for taking profits before a major market reversal.
Harnessing Momentum Oscillators
While moving averages identify trends, momentum oscillators help traders gauge the strength of those trends and potential turning points. These indicators move within a set range and are essential for spotting overbought or oversold conditions.
The Relative Strength Index (RSI)
The Relative Strength Index (RSI) is a versatile momentum oscillator that ranges from 0 to 100. It measures the speed and magnitude of recent price changes to evaluate whether an asset is overvalued or undervalued. The default setting usually looks back at the last 14 periods. Traders typically watch two key levels: 70 and 30.
An RSI reading above 70 indicates that an asset may be overbought, suggesting that buying momentum is stretched and a pullback could be imminent. Conversely, an RSI below 30 suggests the asset is oversold, which might precede a price bounce. Traders also look for "divergences," where the price makes a new high but the RSI makes a lower high. This discrepancy often warns that the current trend is losing steam and a reversal may follow.
Moving Average Convergence Divergence (MACD)
The MACD is a trend-following momentum indicator that shows the relationship between two exponential moving averages (EMAs) of an asset's price. It consists of the MACD line (derived from the difference between 12-period and 26-period EMAs), a signal line (a 9-period EMA of the MACD line), and a histogram.
Traders look for crossovers between the MACD line and the signal line. A "bullish crossover" happens when the MACD line crosses above the signal line, indicating upward momentum. A "bearish crossover" occurs when it drops below. The histogram visualizes the distance between the two lines; as the bars grow larger, the momentum strengthens. The MACD is particularly useful for confirming trends identified by other tools, acting as a reliable secondary filter for trade setups.
The Stochastic Oscillator
The Stochastic Oscillator is another momentum indicator that compares a specific closing price of an asset to a range of its prices over a certain period. Like the RSI, it moves between 0 and 100. It consists of two lines: the %K line (the current price measure) and the %D line (a moving average of %K).
This tool is considered a "leading" indicator because it can signal momentum shifts before they manifest in price reversals. Readings above 80 are considered overbought, while readings below 20 are oversold. The Stochastic Oscillator is highly effective in sideways or non-trending markets, helping traders identify precise entry and exit points by watching for the %K line to cross the %D line within these extreme zones.
Market Context: Volume and Volatility
Technical indicators do not exist in a vacuum. To validate signals from chart patterns or oscillators, traders must consider the broader market context provided by trading volume and volatility. These two factors act as the "truth serum" for price movements, revealing the conviction behind trends.
The Role of Trading Volume
Trading volume represents the total amount of an asset traded within a specific period. It serves as a critical confirmation tool. For example, a price breakout accompanied by high trading volume suggests strong market conviction and indicates that the trend is likely to continue. This is because many participants are involved in the move.
Conversely, if a price rises on low volume, it suggests a lack of support. This is often a warning sign that the trend is weak and susceptible to reversal. Volume also helps identify accumulation and distribution phases. High volume during a sideways price movement can indicate that "whales" or institutional investors are building positions before a major move.
Understanding Volatility
Volatility measures the speed and extent of price changes. High volatility is a hallmark of cryptocurrency markets, offering both significant risk and reward. It is often measured using standard deviation, which quantifies how far prices deviate from their average. High volatility indicates uncertainty and often precedes rapid price swings.
Traders must respect volatility as a component of risk management. Low volatility periods, where prices move slowly and predictably, are often described as "boring" but can precede explosive moves. Conversely, periods of extreme volatility require tighter stop-loss orders and smaller position sizes to protect capital. Understanding the current volatility environment helps traders adjust their strategies to fit the market mood, avoiding the trap of applying a calm-market strategy during a market storm.
Conclusion
Mastering crypto trading is not about finding a single "magic" indicator but rather about constructing a robust system that integrates multiple analytical perspectives. By combining fundamental analysis of a project's value with technical analysis of price charts and sentimental analysis of market psychology, traders gain a complete view of the ecosystem. The visual data from candlestick charts serves as the foundation, allowing traders to spot immediate patterns and price action.
Furthermore, the strategic application of indicators elevates a trader's ability to forecast moves. Trend-following tools like the Golden Cross and Pi Cycle Top provide macro-level guidance, while momentum oscillators like the RSI, MACD, and Stochastic Oscillator offer precise signals for timing entries and exits. Validating these signals with volume and volatility data ensures that decisions are backed by market conviction rather than noise.
Success in crypto trading comes from disciplined practice, continuous learning, and the patience to wait for multiple indicators to align before acting.