
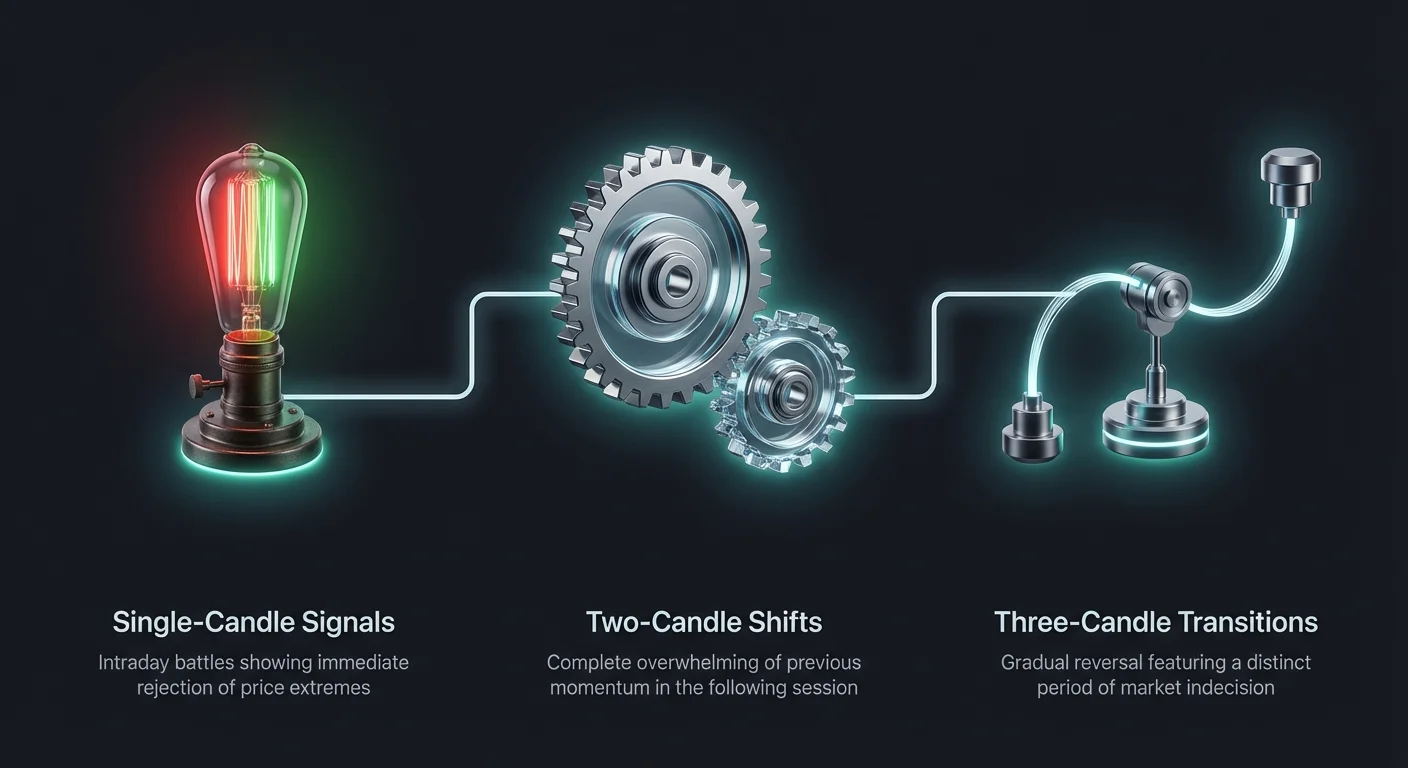
Technical analysis in the cryptocurrency market often relies on interpreting the subtle signals left behind by price action. In a landscape defined by high volatility and rapid sentiment shifts, understanding the narrative behind specific candlestick formations is essential for traders. Among the most critical signals are those that indicate indecision, exhaustion, and the potential for a decisive reversal. These patterns, which often occur at the extremes of trends, tell a story of a battle between buyers and sellers where momentum is about to change hands. By recognizing the signs of price compression and the subsequent release of energy, market participants can identify opportunities with favorable risk-reward profiles.
The ability to read these signals goes beyond simply memorizing shapes. It requires an understanding of market psychology. Every wick, body, and closing price represents the collective emotions and decisions of millions of participants. When a trend extends too far, the opposing side eventually steps in, creating friction that manifests as specific chart patterns. Whether it is a single candle showing a rejection of lower prices or a complex three-candle formation signaling a gradual turnover, these technical structures serve as the language of market efficiency. Mastering this language allows traders to anticipate moves rather than merely reacting to them.
The Psychology of Market Indecision and Reversal
At the core of every trend reversal is a period of indecision or a sudden shift in dominance. In a strong uptrend, buyers are aggressive, and sellers are passive. As the price climbs, however, buyers eventually become exhausted, and those holding the asset may look to take profits. This creates a window where supply begins to match demand. The price action during this transition often tightens, forming candles with small bodies or long shadows. This visual representation of indecision is often the precursor to a new trend direction.
Conversely, in a downtrend, fear drives selling pressure until the asset reaches a price point that value investors find attractive. The moment sellers run out of inventory and buyers step in with limit orders, the aggressive downward movement halts. The resulting price compression on the chart often signals that the "easy" directional move is over. Traders who can identify these zones of friction are better positioned to spot the exact moment when control shifts from one group to the other.
The interpretation of these signals depends heavily on context. A reversal pattern that forms in the middle of a sideways range is often just noise. However, that same pattern appearing after a sustained trend or near a historical support level carries significant weight. It suggests that the prevailing momentum has hit a wall and that a counter-move is likely. Therefore, successful analysis involves combining the visual pattern with the broader market structure to filter out low-probability setups.
The Rising Bullish Hammer: A Tale of Buyer Resilience
The rising hammer, commonly known simply as the bullish hammer, is one of the most recognizable single-candle reversal patterns. It typically forms at the bottom of a downtrend and provides an early indication that the market is trying to find a floor. The visual structure of the hammer is distinct and tells a clear story of intraday volatility that resolved in favor of the bulls.
To identify this pattern, traders look for a candle with a small real body located near the top of the trading range. The most defining feature is the long lower shadow, or wick, which should be at least two to three times the length of the body. This long wick represents a deep price dip that occurred during the session. Sellers successfully pushed the price down, potentially triggering stop-losses and creating panic. However, they could not sustain those low levels.
By the time the candle closed, buyers had absorbed the selling pressure and pushed the price all the way back up near the opening level. This rejection of lower prices indicates that the bearish momentum is fading and that demand is entering the market. While the color of the body can be red or green, a green body is generally considered more bullish because it shows that buyers not only recovered the losses but managed to close higher than the open.
The location of the hammer is paramount. It must appear after a defined downtrend to be valid. A hammer-like shape in a choppy or sideways market does not carry the same reversal implications. Furthermore, the signal is stronger if the lower wick touches a known support zone or a psychological price level. This confluence suggests that technical buyers are defending a specific area, adding credibility to the potential reversal.
Despite its strength, a hammer should rarely be traded in isolation. The pattern shows that buyers are stepping in, but it does not guarantee the downtrend is over. Prudent traders wait for confirmation, which usually comes in the form of the next candle closing higher than the hammer. This follow-through proves that the buying interest was not just a momentary anomaly but the start of a sustained recovery.
The Shooting Star: Identifying Bullish Exhaustion
The shooting star is the bearish counterpart to the hammer and serves as a warning signal at the top of an uptrend. Often referred to as a falling hammer, this pattern appears when bullish momentum begins to stall and sellers make their first significant stand. It is a powerful visual cue that the buyers' control over the market is slipping.
Structurally, the shooting star features a small real body positioned near the bottom of the candle's range, accompanied by a very long upper shadow. This upper wick must be at least twice the length of the body, while the lower shadow should be minimal or non-existent. The long upper tail tells the story of a failed rally. During the session, buyers pushed the price significantly higher, likely fueled by late-arriving participants or "FOMO" (fear of missing out).
However, this push to new highs was met with overwhelming selling pressure. By the close of the candle, sellers had forced the price back down to near the opening level, erasing the intraday gains. This rejection of higher prices signals that the market has found a resistance level that it cannot easily break. The failed attempt to continue the trend often leaves bullish traders trapped in losing positions near the highs, creating future selling pressure as they try to exit.
Like the hammer, the context of the shooting star is critical. It is only a valid reversal signal if it appears after a clear uptrend. A shooting star that forms within a consolidation range is less significant. The pattern is most effective when the long upper wick pierces a known resistance level but fails to close above it. This "false breakout" scenario traps breakout traders and emboldens bears to open short positions.
Confirmation is also essential for the shooting star. A single candle showing rejection is a warning, but the trend remains technically bullish until price action confirms the reversal. Traders typically look for the next candle to be bearish and to close below the low of the shooting star. This confirms that the sellers have maintained control and that a downward correction is underway.
| Feature | Rising Hammer | Shooting Star |
|---|---|---|
| Trend Context | End of Downtrend | End of Uptrend |
| Visual Key | Long Lower Wick | Long Upper Wick |
| Signal | Bullish Reversal | Bearish Reversal |
| Psychology | Rejection of Lows | Rejection of Highs |
Engulfing Patterns: Visualizing Momentum Shifts
While hammers and shooting stars rely on wicks to tell a story of rejection, engulfing patterns use the candle bodies to demonstrate a complete shift in power. An engulfing pattern is a two-candle formation that signals a strong reversal of the immediate trend. It represents a scenario where one side of the market completely overpowers the other, often leading to a rapid change in direction.
The bullish engulfing pattern appears after a downtrend or a price decline. The first candle in the formation is a red (bearish) candle, reflecting the ongoing selling pressure. The second candle is green (bullish) and is significantly larger. Crucially, the body of the green candle must completely cover, or "engulf," the body of the previous red candle. This visual dominance indicates that buyers have stepped in with such force that they have wiped out all the selling progress from the prior period.
The psychology behind the bullish engulfing pattern is one of surprise and overwhelming demand. The session typically opens lower than the previous close, initially looking like a continuation of the downtrend. However, aggressive buying steps in, driving the price up through the previous opening level. This creates a "V-shaped" recovery on lower timeframes and signals that market sentiment has flipped from fear to greed.
Conversely, the bearish engulfing pattern marks the potential end of an uptrend. It begins with a smaller green candle, followed by a large red candle that completely engulfs the previous body. This formation suggests that the bulls have run out of steam and that sellers have taken aggressive control. The market opens higher, perhaps attempting to continue the trend, but is met with a wall of supply that drives the price down below the previous session's low.
For both patterns, the relative size of the candles matters. A very small first candle followed by a massive engulfing candle is a stronger signal than two candles of similar size. Additionally, high trading volume on the second, engulfing candle adds significant weight to the setup. It confirms that the reversal is backed by real capital and participation, rather than just a lack of liquidity.
Traders often use the engulfing pattern as a trigger for entry. For a bullish engulfing, a long position might be taken at the close of the green candle, with a stop loss placed below the low of the formation. For a bearish engulfing, the strategy is inverted. However, as with all patterns, trading them near key support or resistance levels increases their reliability compared to trading them in "no man's land."
The Morning Star: A Gradual Bullish Turn
Reversals do not always happen in a single dramatic session. Sometimes, the market undergoes a transition phase where momentum slows, pauses, and then reverses. The Morning Star is a three-candle pattern that captures this gradual shift from bearishness to bullishness. It is considered a highly reliable indicator of a market bottom because it includes a specific period of indecision before the new trend begins.
The pattern unfolds in three distinct stages. The first component is a long red candle that aligns with the existing downtrend. This candle confirms that sellers are still in control and pushing prices lower. The market sentiment at this stage is firmly negative.
The second component is the star itself. This is a small-bodied candle that gaps lower or opens near the previous close. The color of this middle candle does not matter as much as its size; it can be red, green, or a Doji (where open and close are virtually the same). The key takeaway from this candle is indecision. After the strong selling of the first candle, the small body of the second candle indicates that the downward momentum has stalled. Sellers are no longer able to drive the price significantly lower, but buyers have not yet taken control. This represents a period of compression and hesitation.
The third component is the confirmation. This is a strong green candle that opens higher and closes well into the body of the first red candle—ideally above its midpoint. This third candle breaks the indecision and signals that the bulls have won the battle. The transition is complete: the market went from strong selling, to hesitation, to strong buying.
The Morning Star is particularly effective because it provides a built-in confirmation mechanism. The third candle proves that the indecision of the middle candle resolved in favor of the bulls. Traders often view the low of the middle candle as a solid support level. If the price stays above this low, the reversal remains valid. This pattern is frequently seen in crypto markets after sharp corrections, marking the point where accumulation begins before the next leg up.
The Evening Star: Signaling the Market Top
Just as the Morning Star signals a bottom, the Evening Star warns of a top. It is a three-candle bearish reversal pattern that forms after a sustained uptrend. It mirrors the structure of the Morning Star but in the opposite direction, guiding traders to spot the moment when bullish euphoria transitions into bearish distribution.
The first candle in the Evening Star is a large green candle, reflecting the ongoing strength of the uptrend. Buyers are confident, and the price is making new highs. This is followed by the second candle, which has a small real body. This "star" indicates that the upward momentum is fading. The market may have gapped up or opened high, but buyers could not sustain the drive. The small range of trading in this session signals indecision and the potential exhaustion of the trend.
The pattern is completed by the third candle, which is a large red candle that closes deeply into the body of the first green candle. This confirms that the hesitation seen in the second candle has resolved with sellers taking control. The sentiment has shifted from bullish to bearish, and the previous uptrend is likely over.
The Evening Star is a favorite among traders for identifying exit points or shorting opportunities. The presence of the middle "indecision" candle is crucial. It represents the distribution phase where smart money may be offloading positions to late retail buyers before the price collapses.
Volume analysis plays a significant role in validating the Evening Star. Ideally, volume should be lower on the first bullish candle and the middle star, indicating drying demand. A spike in volume on the third, bearish candle then confirms that selling pressure is intensifying. This combination of price structure and volume dynamics creates a high-probability signal for a trend reversal.
Comparison of Star Patterns
| Component | Morning Star (Bullish) | Evening Star (Bearish) |
|---|---|---|
| Candle 1 | Long Red (Downtrend) | Long Green (Uptrend) |
| Candle 2 | Small Body (Indecision) | Small Body (Indecision) |
| Candle 3 | Long Green (Reversal) | Long Red (Reversal) |
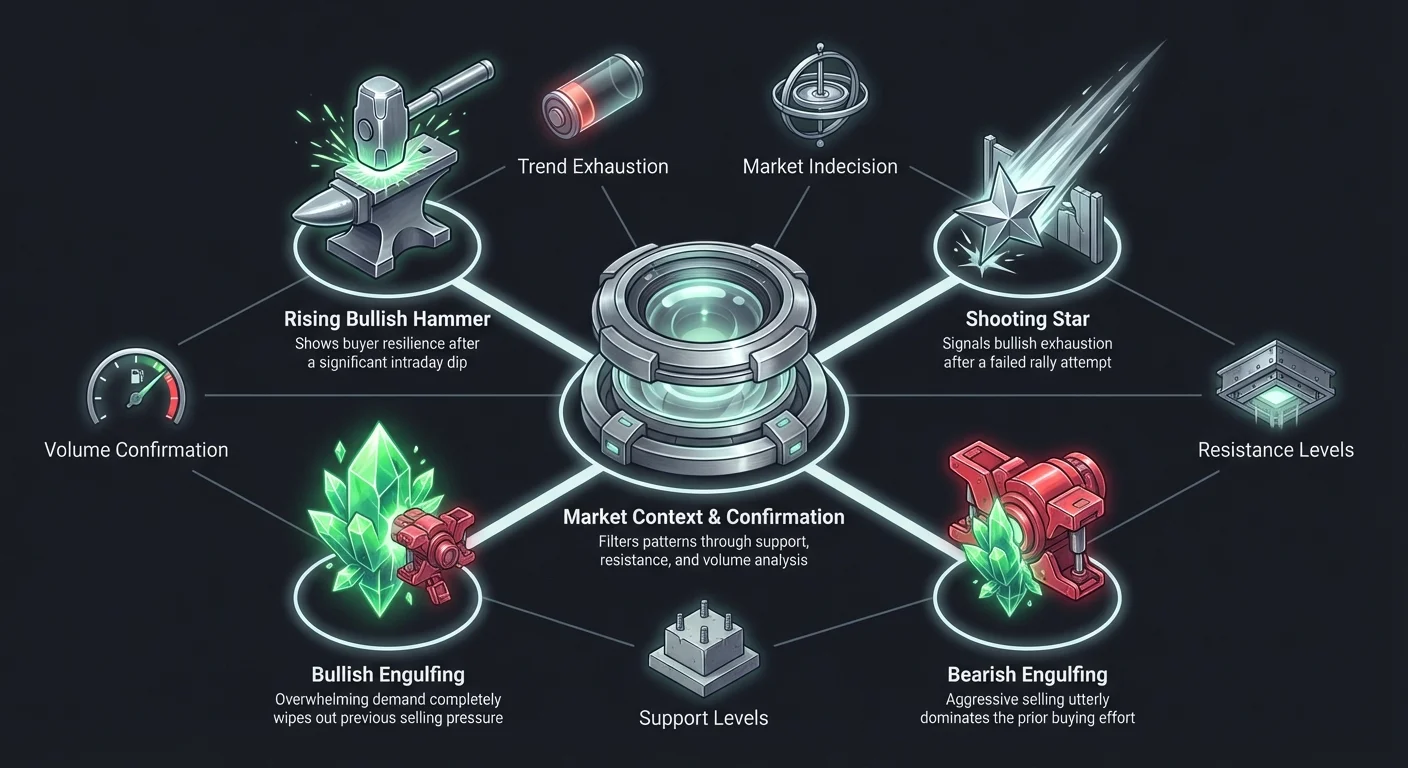
The Vital Role of Market Context and Confirmation
While candlestick patterns like Hammers, Shooting Stars, and Engulfing formations offer valuable insights, they are rarely sufficient on their own. The broader market context acts as a filter, helping traders distinguish between high-probability setups and market noise. A "perfect" looking hammer that forms in the middle of a tight consolidation range usually means very little. Conversely, a slightly imperfect hammer that forms exactly at a 200-week moving average or a major historical support level is a signal that demands attention.
Support and resistance levels are the primary context traders must check. Reversal patterns are essentially signs that a barrier is holding. A bullish engulfing pattern is most potent when it launches off a support floor. A shooting star is most dangerous to bulls when it rejects a resistance ceiling. Without these structural barriers, the patterns lack a definitive reference point.
Technical indicators also serve as excellent confirmation tools. Oscillators like the Relative Strength Index (RSI) can indicate if an asset is overbought or oversold. For instance, a bullish hammer forming when the RSI is below 30 (oversold) is a much stronger signal than one forming when the RSI is at 50 (neutral). Similarly, the Moving Average Convergence Divergence (MACD) can help confirm momentum shifts. A bullish cross on the MACD coinciding with a Morning Star pattern provides a layer of confluence that increases trade confidence.
Volume is another non-negotiable factor for many professionals. A reversal pattern that occurs on low volume suggests a lack of conviction. It might simply mean that the dominant side took a break, not that the trend has changed. High volume on a reversal candle, especially on the "confirming" candle of a pattern, indicates that money is actively changing hands and that a significant number of participants are backing the move.
Risks and Limitations in Volatile Markets
No technical analysis tool is a crystal ball, and candlestick patterns are no exception. In the crypto market, which is known for its extreme volatility and 24/7 trading hours, false signals are common. A "fakeout" occurs when a pattern forms, triggering traders to enter positions, only for the price to immediately reverse against the signal. This is often the result of "stop hunting," where the market briefly moves to trigger stop-loss orders before resuming its original direction.
Different timeframes also impact the reliability of these signals. Patterns observed on short timeframes, such as the 1-minute or 5-minute charts, are highly susceptible to noise and random variance. They produce frequent signals that often fail. In contrast, patterns on the 4-hour, daily, or weekly charts carry much more weight because they represent a larger dataset of market activity and sentiment. A daily Shooting Star is a major event; a 5-minute Shooting Star is a common occurrence.
Traders must also be wary of trading against a strong trend without sufficient evidence. Trying to catch a "falling knife" by buying every hammer in a steep crash can be disastrous. It is often safer to wait for the pattern to complete and for a subsequent confirmation candle to close before entering a trade. This patience might result in a slightly worse entry price, but it significantly reduces the risk of entering a trade prematurely.
Conclusion
Mastering the interpretation of candlestick patterns is a fundamental skill for navigating the complexities of the cryptocurrency market. Patterns like the Rising Hammer, Shooting Star, Bullish and Bearish Engulfing, and the Morning and Evening Stars provide a visual roadmap of market psychology. They reveal the moments when indecision resolves into action and when trends reach their breaking points. By understanding the specific anatomy and implications of each pattern, traders can gain a clearer view of the battles occurring between buyers and sellers.
However, the true power of these signals lies in their application within a broader strategy. Relying solely on the shape of a candle is a recipe for inconsistency. Success comes from combining these patterns with an analysis of support and resistance, volume, and momentum indicators. By waiting for confirmation and respecting the market context, traders can filter out noise and focus on the high-probability setups that offer the best potential for profit. In a market defined by volatility, these patterns serve as essential tools for identifying the turning points that matter.
The most effective trading decisions come from patiently waiting for clear signals to form at key levels rather than chasing every movement on the chart.