
Kada istražujete digitalnu ekonomiju, mnogi novopridošli se fokusiraju isključivo na kretanja cena i tržišnu hajp. Međutim, prava održivost i dugoročni potencijal kripto aktive određuje njen fundamentalni dizajn — ekonomska struktura poznata kao tokenomika.
Tokenomika (spoj „tokena“ i „ekonomije“) se odnosi na karakteristike i pravila koja upravljaju digitalnom imovinom. Ona definiše kako se token kreira, distribuira, koristi i kako se njegova vrednost namerava održavati ili povećavati tokom vremena. Ako je token gorivo za decentralizovanu mrežu, tokenomika je nacrt dizajna motora.
Za samostalne investitore, ovladavanje tokenomikom je ključno. Omogućava vam da gledate iza površnih metrika i uočite potencijalne crvene zastavice, kao što su nadolazeći šokovi ponude, preterano centralizovana kontrola ili neodržive stope inflacije. Ovaj vodič pruža rigorozni analitički okvir neophodan za procenu bilo koje kripto aktive kao iskusni veteran, osiguravajući da vaše investicione odluke budu utemeljene u strukturnoj realnosti, a ne samo u spekulacijama.
Decoding Supply: Circulating vs. Fully Diluted Valuation
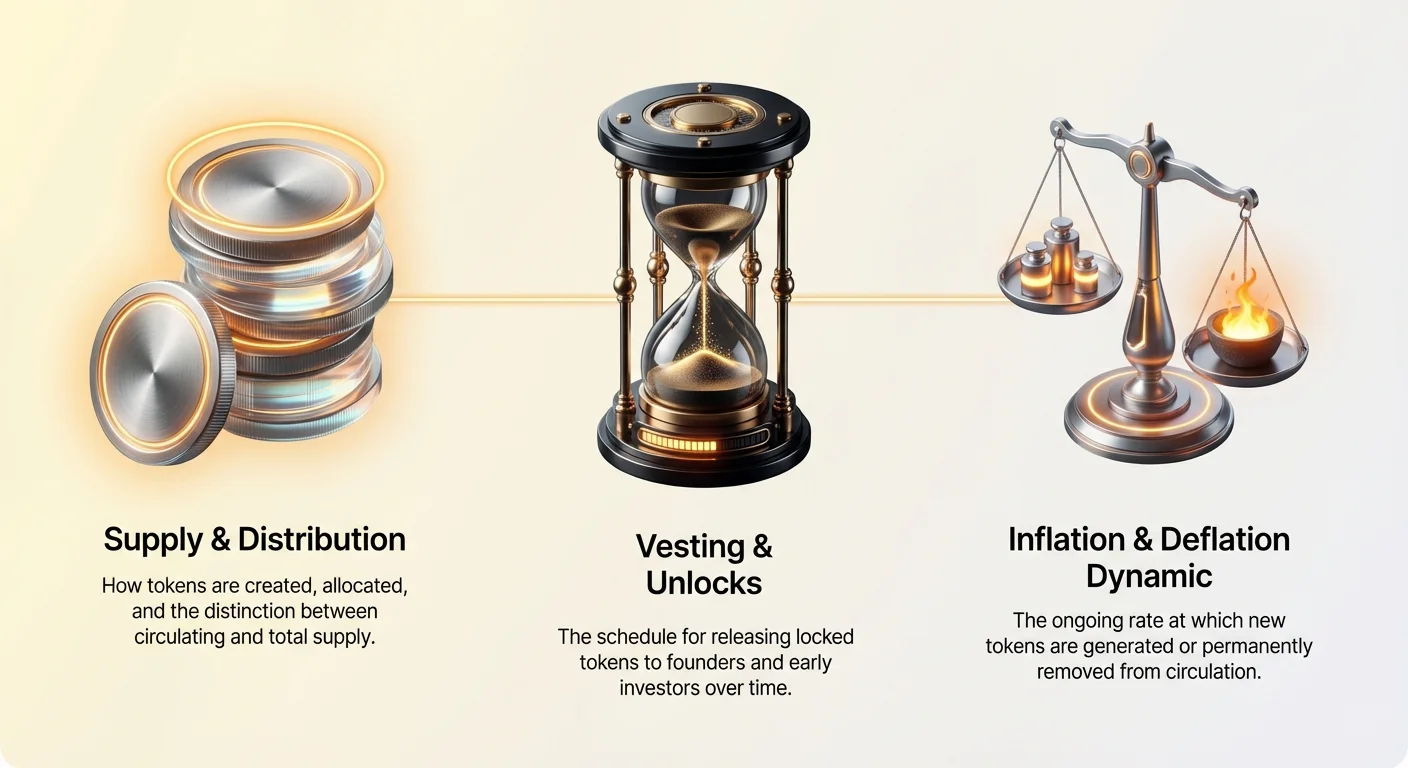
The first step in any tokenomics analysis is understanding the asset’s supply structure. Unlike traditional stock markets, where the total number of shares is usually fixed and known, crypto assets often have dynamic supplies influenced by mining, burning, and scheduled releases.
Understanding Total Supply and Circulating Supply
Every token project defines a Total Supply, which is the maximum number of tokens that will ever exist (if it has a hard cap, like Bitcoin’s 21 million), or the current maximum set by the protocol.
The Circulating Supply is the number of tokens currently available to the public and actively trading on the market.
Why the distinction matters: If a project has a Total Supply of 1 billion tokens, but only 100 million are currently circulating (10%), that means 900 million tokens are yet to enter the market. If these 900 million tokens are released too quickly, they represent a massive potential selling pressure that can dramatically depress the price.
The Critical Metric: Fully Diluted Valuation (FDV)
To account for future supply releases, analysts use the Fully Diluted Valuation (FDV). FDV answers the question: What would the market capitalization be if every single token that will ever exist was released and trading today?
The calculation is straightforward:
FDV in Practice:
Imagine Project Alpha has:
- Circulating Supply: 100 million tokens
- Current Price: $1.00
- Market Cap: $100 million
Imagine Project Beta has:
- Total Supply: 1 billion tokens (900 million are locked)
- Current Price: $1.00
- FDV: 1,000,000,000 tokens $1.00 = $1 billion
While both projects have the same market capitalization today ($100 million), Project Beta's FDV is ten times higher. This means that future growth for Beta must absorb the future sale of 900 million tokens before the existing holders see significant proportional price appreciation.
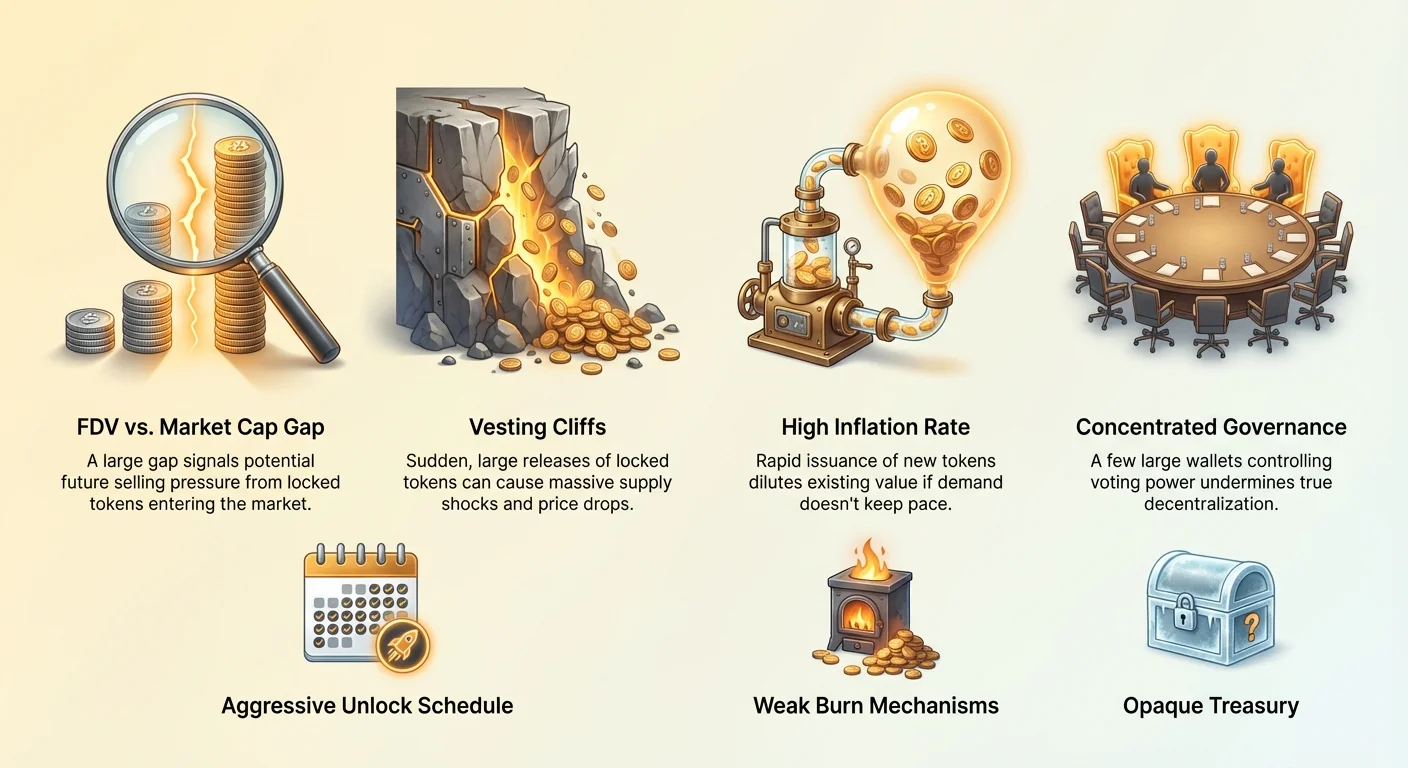
Actionable Tip: Always compare the Market Cap to the FDV. If a project's FDV is significantly higher (5x to 10x) than its Market Cap, it signals substantial inflation risk down the line due to future unlock events. High FDV relative to current Market Cap is a major tokenomics red flag unless the unlock schedule is very aggressive and the utility model is proven.
The Hidden Risks: Analyzing Vesting and Unlock Schedules
The most critical factor influencing short-to-medium-term price stability is the vesting schedule. This schedule determines when founders, early investors (Venture Capital/VCs), and development teams are allowed to sell the tokens they received at low, private-sale prices.
What is Vesting and Why Does it Exist?
Vesting is a fundamental mechanism borrowed from the traditional tech world. It ensures that those who received tokens early (often at a massive discount) are incentivized to stay with the project for the long haul. They receive their tokens not all at once, but over an extended period.
Vesting schedules typically contain two components:
- The Cliff: This is a waiting period, often 6 or 12 months, where no tokens are released. If the team leaves or fails to deliver before the cliff, they receive nothing.
- The Linear Release: Once the cliff is passed, the locked tokens begin to release to the holders daily, weekly, or monthly over the remainder of the vesting period (often 2 to 4 years).
Analyzing the Vesting Distribution:
When reviewing a whitepaper or tokenomics document, focus on the percentage of the supply allocated to these groups:
| Allocation Group | Typical Vesting Schedule | Risk Profile |
|---|---|---|
| Founders/Team | 3-4 years, 1-year cliff | Necessary alignment, but potential for large dump post-vesting. |
| Private Investors/VCs | 1-3 years, 6-12 month cliff | Most dangerous. They bought cheap and may sell aggressively at the first major pump. |
| Treasury/Ecosystem | Non-vested, controlled by governance. | Potential for centralization if distribution is poorly managed. |
| Community/Airdrops | Often fully unlocked (no vesting). | Minimal risk, as tokens are widely dispersed. |
Identifying "Supply Shocks"
A supply shock occurs when a massive, coordinated release of tokens hits the market at the same time, often overwhelming buying demand and causing the price to drop significantly.
To analyze this risk, you must map the unlock schedule:
- Find the Schedule: Locate the official schedule (usually a chart or timeline in the project’s documentation).
- Identify Key Dates: Mark the dates where the "Cliff" periods for large groups (VCs or the Team) expire.
- Calculate the Percentage: Determine what percentage of the current circulating supply is scheduled to be unlocked on that date.
Example of a Red Flag:
If the circulating supply is 100 million tokens, and the vesting schedule shows that 50 million founder/VC tokens unlock in a single month (a 50% supply increase), this is a catastrophic short-term risk, regardless of the project's utility. The market must immediately absorb a 50% increase in potential sellers.
Best Practice: Look for schedules that prioritize long, linear, and small releases over large, irregular lump-sum releases. The smoother the supply curve, the less risk of unexpected market disruption.
Case Study: Treasury Allocation and Use of Funds
While the vesting of VCs and founders is crucial, the Treasury allocation—tokens reserved for future development, grants, or ecosystem growth—warrants equal scrutiny.
Projects often reserve a significant portion of their supply (sometimes 20% to 40%) in a community treasury, managed by the core team or a decentralized autonomous organization (DAO).
What to Look For:
- Transparency: Is the treasury wallet address publicly known? Can you audit where the funds are going?
- Clear Mandate: Does the whitepaper detail how the treasury funds will be spent (e.g., grants for developers, marketing, liquidity provisioning)?
- Control: Who votes on the treasury allocation? If the initial team holds a majority of the governance power, they essentially control the funds, raising centralization concerns.
A well-designed treasury model ensures longevity and continuous development funding, but a poorly managed or opaque treasury is often a vector for unchecked insider spending.
The Inflation and Deflation Dynamic
Beyond initial unlocks, the ongoing rate at which new tokens are created or existing tokens are removed is critical to assessing an asset's long-term store of value proposition.
Inflationary vs. Deflationary Models
Token creation can generally be categorized as inflationary or deflationary:
- Inflationary Models: The supply constantly increases (e.g., tokens are continuously minted to pay for staking rewards, network security, or mining rewards). Bitcoin, which mints new coins every block, is technically inflationary until its final supply cap is hit.
- Analysis Focus: Can the utility and demand for the asset grow faster than the inflation rate? If the network issues 10% new tokens per year, the network usage must grow by more than 10% just to maintain the current price.
- Deflationary Models: The supply decreases over time, usually through "burning" mechanisms (permanently removing tokens from circulation).
- Analysis Focus: How effective is the burning mechanism? Is it tied to network activity (e.g., transaction fees are burned), or is it a one-off event?
Evaluating Staking Rewards and Emission Rates
For Layer 1 (L1) chains like Ethereum (post-Merge) or Solana, security is often guaranteed by staking, where users lock up tokens to validate transactions. In return, they receive staking rewards, which are frequently newly minted tokens.
This is where inflation becomes an economic cost:
- Identify the Source: Confirm if staking rewards come from new token issuance (inflation) or transaction fees (sustainable).
- Calculate the Net Effect: Compare the annual inflation rate (how many new tokens are minted) against the amount of tokens being burned (often through transaction fee destruction).
The Inflationary Trap:
Projects that offer extremely high staking APYs (e.g., 50% or 100%) are often paying those rewards with massive inflation. While your nominal token count increases, the value of each token rapidly dilutes. The token’s price may fall faster than your staking rewards are earned, leading to a loss of capital despite receiving a high yield. High yields often signal high long-term structural risk.
Assessing the Burning Mechanism
Deflationary mechanisms are designed to counteract inflation and reduce supply scarcity. The most robust burning models are those intrinsically tied to genuine economic activity on the network.
Strong Burn Mechanisms:
- Transaction Fee Burning (e.g., Ethereum's EIP-1559): A portion of every transaction fee is permanently removed. This means that as network usage (demand) increases, the rate of burning increases, creating a direct link between utility and scarcity.
- Protocol Revenue Burns: Tokens used to pay for specific services within the ecosystem (like domain names or NFTs) are burned.
Weak Burn Mechanisms:
- Manual or Irregular Burns: Burns decided upon by a core team (e.g., "We will burn 5% of the treasury once per year"). These are centralized, unpredictable, and less effective at creating continuous scarcity.
Analysis Rule: A tokenomics model is healthiest when its inflationary issuance (rewards) is primarily covered by its deflationary removal (fees/burns), aiming for a net-zero or net-negative inflation rate during periods of high demand.
Upravljanje: Ko kontroliše brod?
Decentralizacija se često navodi kao ključna vrednosna ponuda kripta. Međutim, tokenomika određuje da li je ta decentralizacija stvarna ili samo nominalna. Mehanizmi upravljanja diktiraju ko ima moć da menja pravila, dodeljuje sredstva i nadograđuje protokol.
Pregled mehanizma upravljanja
Većina modernih kripto protokola koristi on-chain upravljanje, gde posednici tokena glasaju o predlozima. Analiza ovog sistema zahteva razumevanje dve ključne metrike:
- Kvorum: Minimalni procenat ukupne ponude u opticaju koji mora učestvovati u glasanju da bi rezultat bio validan. Nizak kvorum (npr. 2%) znači da kritične odluke može doneti mala, angažovana manjina. Visok kvorum (npr. 20%) osigurava širi konsenzus zajednice.
- Prag: Minimalni procenat „Da“ glasova neophodan za prolaz predloga.
Identifikacija rizika centralizacije:
Ako inicijalni novčanici osnivača i VC, čak i ako su tehnički „u vestiranju“, drže značajnu moć upravljanja, projekat je visoko centralizovan. Mehanizam upravljanja je robustan samo ako je moć široko distribuirana i barijera za prolaz predloga (kvorum/prag) dovoljno visoka da zahteva široki konsenzus.
Analiza koncentracije moći i učešća na glasanju
Kritičan korak je revizija distribucije tokena, posebno među najvećim posednicima — često zvanim „kitovi“.
Problem kitova:
Ako mala grupa novčanika (npr. top 100) kontroliše većinu ponude u opticaju, oni mogu lako nadjačati bilo koju inicijativu ili glasanje zajednice, bez obzira na pravila kvoruma.
Koraci za analizu:
- Koristite block explorer: Koristite block explorer projekta (kao Etherscan) da pogledate stranicu distribucije tokena.
- Identifikujte top posednike: Pogledajte top 10 ili top 100 posednika.
- Proverite poznate entitete: Pokušajte da utvrdite da li ovi veliki novčanici pripadaju jezgru tima, VC ili blagajni projekta. Ako je većina glasačke moći koncentrisana u rukama poznatih insajdera, projektu nedostaje prava decentralizacija.
Praktičan savet: Tražite dokaze aktivnog, decentralizovanog učešća u upravljanju. Da li predlozi dolaze od raznih članova zajednice? Da li su glasovi široko raspršeni, ili isti mali broj adresa dominira svakom odlukom? Visoko učešće ukazuje na zdravu, samoregulisajuću zajednicu.
Metrike potpuno razblažene valorizacije (FDV) ponovo
Prethodno smo definisali FDV, ali moramo ga koristiti kao alat za komparativnu analizu.
Prilikom analize Altcoina, poređenje FDV konkurentnih projekata je često rečitije od poređenja trenutnih kapitalizacija tržišta.
Scenarij:
- Konkurent A (Zreli L1): Kapitalizacija tržišta $50 milijardi, FDV $60 milijardi (95% ponude oslobođeno).
- Konkurent B (Novi L1): Kapitalizacija tržišta $5 milijardi, FDV $50 milijardi (10% ponude oslobođeno).
Iako Konkurent B izgleda jeftinije na papiru ($5 milijardi kapitalizacije tržišta), njegov FDV implicira da je cenovno gotovo identičan uspostavljenom Konkurentu A ($50 milijardi naspram $60 milijardi) kada se uzme u obzir buduća ponuda. Da bi Konkurent B postigao trenutnu kapitalizaciju tržišta Konkurenta A ($50 milijardi), njegova trenutna cena mora desetostruko porasti, i mora uspešno apsorbovati prodajni pritisak od preostalih 90% zaključanih tokena.
Ovaj pogled pomaže investitorima da izbegnu zabludu niskom trenutnom kapitalizacijom tržišta kada je ogromno razblaživanje tokena neizbežno.
Zaključak
Tokenomika je rigorozna studija strukturne vrednosti — to je razlika između investiranja u održivi poslovni model i spekulacije na privremenoj hajpu. Primenom kritičke analize na dinamiku ponude (FDV), rasporede otključavanja (klifovi vestiranja i linijarna oslobađanja), inflacione pritiske i rizike centralizacije (upravljanje i kontrola blagajne), opremate se alatima neophodnim da uočite fundamentalne crvene zastavice. Da bi samostalnost bila efikasna, mora biti uparena sa intelektualnom rigoroznošću. Koristite ovaj okvir da pređete iznad površnih metrika i izgradite portfolija utemeljeno u verificiranoj, dugoročnoj ekonomskoj održivosti.