
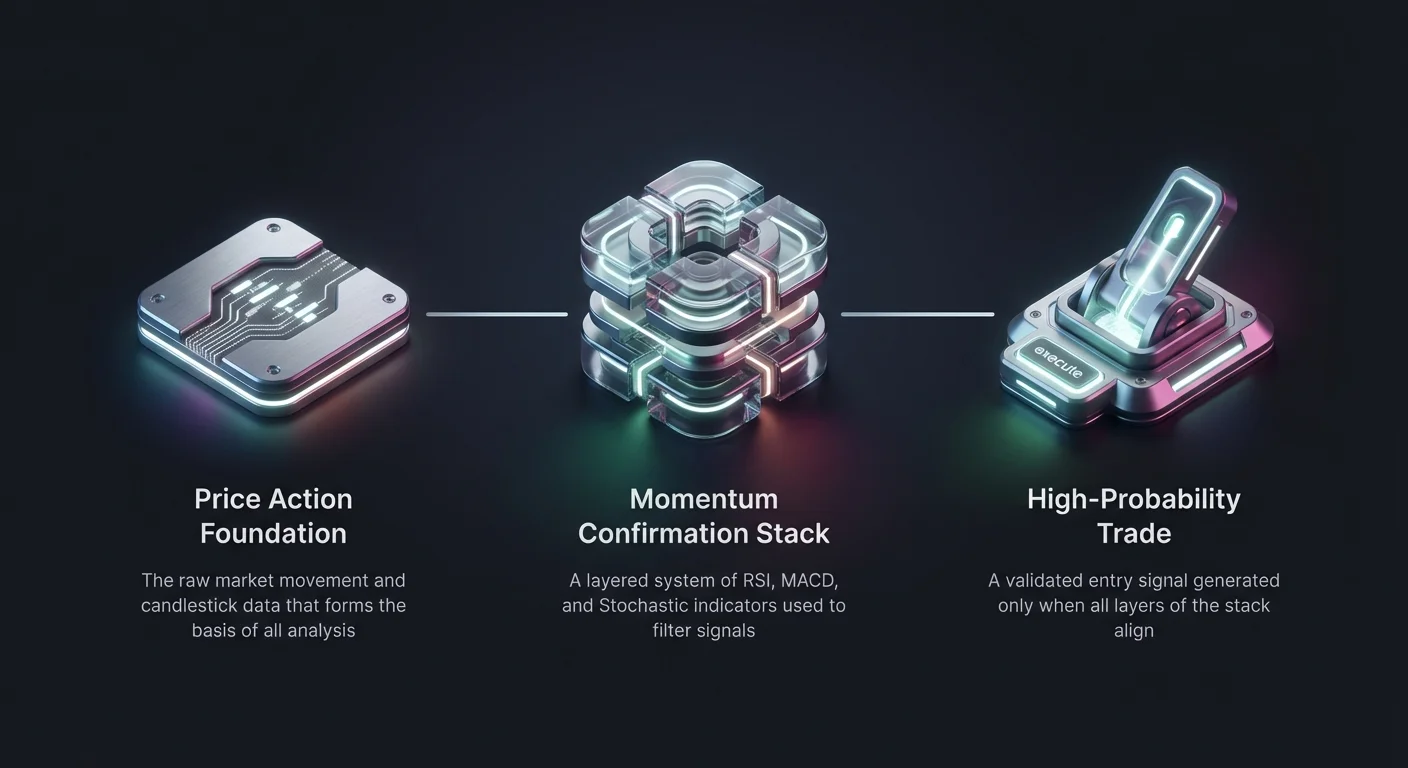
Successful cryptocurrency trading often requires more than a simple hunch or a single line on a chart. The volatile nature of digital assets means that price action can be deceptive. Sudden spikes may look like breakouts but turn into traps, while sharp drops might resemble crashes but end up being temporary corrections. To navigate this uncertainty, professional traders rarely rely on one tool in isolation. Instead, they build a system of checks and balances known as a confirmation stack.
A confirmation stack involves layering multiple technical indicators that measure different aspects of market behavior. By requiring agreement from distinct tools before executing a trade, you can filter out market noise and increase the probability of success. Three of the most powerful tools for this purpose are the Relative Strength Index (RSI), the Moving Average Convergence Divergence (MACD), and the Stochastic Oscillator.
While each of these indicators provides value on its own, they become significantly more potent when combined. One measures internal strength, another tracks trend direction, and the third pinpoints entry timing. This article explores how to synthesize these three distinct signals into a cohesive strategy for high-probability entries.
The Foundation of Technical Analysis
Before diving into specific indicators, it is essential to understand the broader context of technical analysis. This discipline relies on historical price data and trading volume to predict future market movements. The core philosophy is that market trends, patterns, and psychological behaviors tend to repeat themselves. However, because crypto markets operate 24/7 and are influenced by global factors, these patterns can be erratic.
Technical analysis helps traders decode the chaos by identifying trends, support levels, and resistance zones. A trend indicates the general direction of the asset, whether upward, downward, or sideways. Support levels represent price floors where buying interest is historically strong, while resistance levels act as ceilings where selling pressure typically increases. Identifying these zones is the first step in any robust trading strategy.
Understanding Price Action
Price action is the raw movement of an asset's value over time, typically visualized through candlestick charts. These charts provide a wealth of information at a glance, showing the open, high, low, and close prices for a specific timeframe. Candlesticks reveal the battle between buyers and sellers. For instance, a long green body indicates buyers were in control, while a long upper wick suggests sellers pushed the price down from a high.
Indicators are derivative tools calculated from this price action data. They smooth out the noise of individual candles to reveal underlying currents. However, indicators should never replace price action analysis. Instead, they should confirm what the candles are already suggesting. If price action shows a strong reversal pattern like a hammer candle at support, indicators can provide the necessary confidence to pull the trigger on a trade.
The Danger of False Signals
A common pitfall for new traders is over-reliance on a single signal. For example, seeing a price cross above a moving average might look like a buying opportunity. However, in a sideways or "choppy" market, prices can cross moving averages repeatedly without establishing a real trend. These are known as false signals or "whipsaws," and they can quickly drain a trading account.
This is where the concept of the stack becomes vital. By using indicators that calculate data differently, you avoid redundancy. Using three different moving averages is not a stack; it is just three versions of the same lag. A proper stack combines a trend-following tool with a momentum oscillator and a volatility gauge. This diversity ensures that a signal is verified from multiple mathematical perspectives before capital is put at risk.
Layer 1: The Relative Strength Index (RSI)
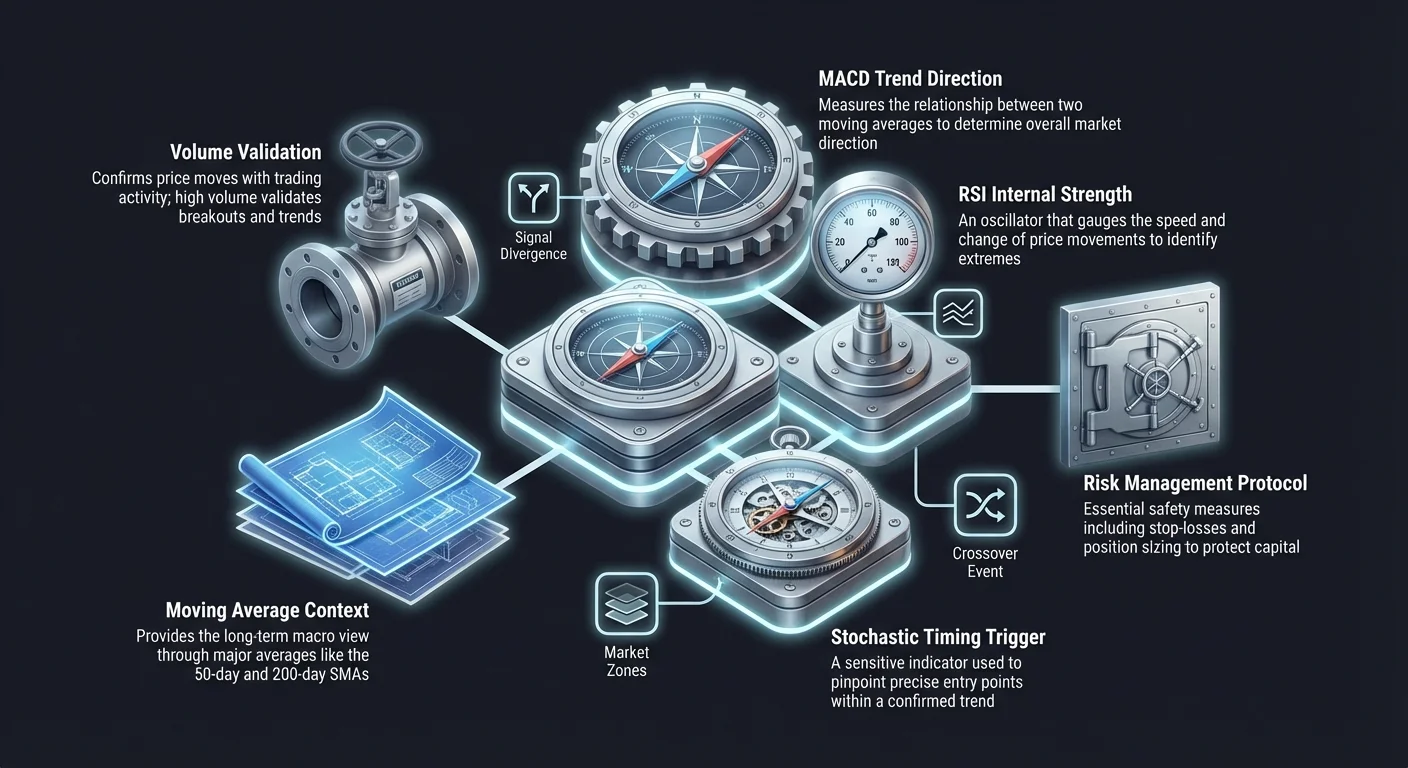
The first layer of our momentum stack is the Relative Strength Index, or RSI. Developed in the late 1970s, this momentum oscillator measures the speed and change of price movements. It oscillates between zero and 100, providing a clear visual representation of the market's internal strength. The RSI is primarily used to identify overbought or oversold conditions, helping traders spot potential reversal points.
The default setting for RSI is 14 periods. On a daily chart, this looks back at the last 14 days of price activity. The formula compares the magnitude of recent gains to recent losses. When buyers are aggressively pushing prices up, the RSI rises. When sellers take control, the RSI falls. This simple mechanic makes it an excellent gauge for the "temperature" of the market.
Reading the Zones
The RSI divides market conditions into three primary zones. The area above 70 is considered "overbought." When the RSI enters this zone, it suggests that the asset's price has risen too quickly relative to its recent history. This often indicates that buying exhaustion is setting in and a pullback or correction may be imminent. It is a warning sign for bulls to be cautious.
Conversely, the area below 30 is considered "oversold." This reading implies that selling pressure has been intense and the price may be undervalued in the short term. When the RSI drops this low, it often signals that sellers are running out of steam, potentially setting the stage for a bounce or a reversal to the upside. The middle line, at 50, serves as a baseline; readings above 50 generally support a bullish trend, while those below support a bearish one.
Identifying Divergences
One of the most powerful signals the RSI can generate is a divergence. This occurs when the price of an asset and the RSI indicator move in opposite directions. A bullish divergence happens when the price makes a lower low, but the RSI makes a higher low. This discrepancy suggests that while the price is still dropping, the downside momentum is weakening, often preceding a sharp rally.
A bearish divergence works the opposite way. It occurs when the price hits a higher high, but the RSI makes a lower high. This indicates that even though the price is rising, the buying strength behind the move is fading. Divergences are often more reliable than simple overbought or oversold readings because they reveal a fundamental crack in the current trend's sustainability.
Layer 2: Moving Average Convergence Divergence (MACD)
The second layer of our stack is the Moving Average Convergence Divergence, or MACD. While RSI measures internal strength, MACD is a trend-following momentum indicator. It tracks the relationship between two moving averages of an asset's price. The MACD is particularly useful for determining the overall direction of the market and the strength of that trend.
The MACD consists of three components: the MACD line, the signal line, and the histogram. The MACD line is derived by subtracting the 26-period Exponential Moving Average (EMA) from the 12-period EMA. The signal line is a 9-period EMA of the MACD line itself. The interaction between these lines provides clear buy and sell signals that complement the data provided by the RSI.
Signal Line Crossovers
The most common trigger generated by this indicator is the crossover. A bullish crossover occurs when the MACD line crosses above the signal line. This event suggests that short-term momentum is accelerating faster than the longer-term average, indicating a potential upward trend. Traders often view this as a confirmation to enter a long position, especially if the crossover happens below the zero line.
A bearish crossover happens when the MACD line drops below the signal line. This signals that short-term momentum is deteriorating, often preceding a price decline. While crossovers are powerful, they are lagging signals, meaning they confirm a move that has already started. This lag is why stacking MACD with a leading indicator like RSI or Stochastic is crucial for timing entries more precisely.
The Histogram and Zero Line
The MACD histogram is a bar chart that visualizes the distance between the MACD line and the signal line. When the histogram is above zero and growing, it indicates strengthening bullish momentum. When it shrinks or flips below zero, it shows that bullish momentum is fading or bearish momentum is taking over. The histogram often reacts faster than the crossover lines, providing an early warning of changing tides.
The zero line acts as the divider between bullish and bearish territory. When the MACD lines are above zero, the general trend is considered bullish. When they are below zero, the trend is bearish. A strategy might involve only taking long trades when the MACD is above zero or crossing above it, ensuring that you are trading with the broader market current rather than swimming against it.
Layer 3: The Stochastic Oscillator
The final layer in our confirmation stack is the Stochastic Oscillator. While it shares similarities with the RSI, the Stochastic Oscillator is more sensitive and faster-moving. It compares a specific closing price of an asset to a range of its prices over a certain period. This sensitivity makes it an excellent tool for pinpointing precise entry and exit points within a broader trend identified by the MACD.
The Stochastic Oscillator moves between zero and 100, utilizing two lines: the %K line (the fast line) and the %D line (the slow signal line). Because it reacts quickly to price changes, it produces more signals than the RSI. This can lead to more noise, which is why it is best used as the final trigger in a stack rather than a standalone trend detector.
Sensitivity and Speed
The primary advantage of the Stochastic Oscillator is its ability to identify turning points early. In a strong uptrend, prices tend to close near the high of the recent range. As the trend weakens, prices start closing lower within that range, even if the absolute price is still high. The Stochastic detects this internal shift before it becomes obvious on the price chart.
This indicator uses 80 and 20 as its key threshold levels. Readings above 80 indicate overbought conditions, while readings below 20 suggest oversold conditions. However, in strong trends, the Stochastic can stay overbought or oversold for extended periods. Therefore, the raw value is less important than the crossover of the %K and %D lines that occurs within these zones.
Refining the Entry Trigger
Traders often use the Stochastic Oscillator to "pull the trigger" on a trade once the other layers of the stack align. For example, if the MACD indicates a bullish trend and the RSI is recovering from oversold territory, a trader might wait for the Stochastic lines to cross up from below the 20 level. This specific crossover serves as the final confirmation that short-term momentum has shifted in favor of the trade.
The combination of the %K line crossing above the %D line is the classic buy signal. Conversely, the %K crossing below the %D is a sell signal. By waiting for this specific event, traders can avoid entering a position too early while a falling knife is still dropping, or too late after the bulk of the move has already occurred.
Synthesizing the Stack for Entries
Now that we understand the individual components, the goal is to combine them into a cohesive workflow. The Momentum Confirmation Stack works by filtering opportunities from the macro view down to the micro trigger. It forces the trader to answer three questions: Is the trend in my favor? Is the asset priced well? Is this the right moment to strike?
The workflow typically begins with the MACD to establish direction. If the MACD lines are rising or have recently completed a bullish crossover, the bias is to the upside. Next, the RSI is checked to ensure the asset isn't already overextended. Ideally, for a long entry, the RSI should not be above 70. Finally, the Stochastic provides the execution signal via a crossover in the oversold region.
| Component | Role | Ideal Condition for Buy Entry |
|---|---|---|
| MACD | Trend Direction | Bullish crossover or rising histogram |
| RSI | Health Check | Not overbought (ideally moving up from 30-50) |
| Stochastic | Timing Trigger | %K crosses above %D below level 20 |
The Sequence of Events
Order matters when using this stack. You should not start with the Stochastic, as its high sensitivity creates too many false positives. Starting with the MACD ensures you are aligned with the broader momentum. Once the trend is confirmed, you look for value using the RSI. You want to buy dips in an uptrend, not chase tops. The RSI helps distinguish a dip from a crash.
Once the trend is confirmed and the value is identified, patience becomes the primary skill. You watch the Stochastic Oscillator. You might see the MACD bullish and RSI neutral, but if the Stochastic is plummeting from 80, it is not time to buy yet. You wait for the Stochastic to bottom out and turn up. This discipline prevents premature entries that suffer from immediate drawdown.
Handling Conflicting Signals
A major benefit of this system is that it naturally pauses trading when signals conflict. If the MACD shows a bullish trend but the RSI is flashing a bearish divergence, the stack is broken. This conflict indicates uncertainty or a transitional market phase. In such cases, the safest action is usually to do nothing and wait for clarity.
Conflicting signals are not failures of the system; they are the system working as intended. They protect capital from low-probability setups. For instance, if the Stochastic gives a buy signal but the MACD is firmly bearish below the zero line, the trade is likely a "fakeout" or a weak counter-trend rally. By ignoring these incomplete setups, you filter out trades that have a lower statistical chance of success.
The Critical Role of Volume
While the RSI, MACD, and Stochastic focus on price data, they do not account for trading activity. This is where volume comes into play. Trading volume represents the total amount of an asset traded during a specific period. It acts as the fuel for price moves. A price movement accompanied by high volume is generally considered more valid and sustainable than one on low volume.
Volume analysis serves as an external validator for the momentum stack. If your three indicators align for a bullish entry, but the buying volume is almost non-existent, the signal is suspect. Professional traders look for volume spikes to confirm breakouts or reversals. Volume confirms that the "smart money" and institutional players are participating in the move, rather than just retail speculators.
Volume as Confirmation
When looking for a breakout from a resistance level, high volume is a non-negotiable requirement. If the price pushes above a key level and your indicators flash green, but volume is declining, it is often a trap. This divergence between price and volume suggests a lack of conviction. The price is likely to roll over and fall back below resistance.
Conversely, during a pullback in an uptrend, you want to see volume decrease. This indicates that the selling pressure is weak and merely a pause in the action. If the price drops to support, the indicators align, and then volume spikes as the price starts to tick up, you have a high-probability scenario. The volume spike confirms that buyers have stepped in aggressively to defend the price.
Market Liquidity Factors
Volume is also a proxy for liquidity. In crypto markets, low liquidity can be dangerous. Assets with low trading volume are susceptible to manipulation and slippage, where you cannot enter or exit a trade at your desired price. High volume ensures that there is enough market depth to absorb buy and sell orders without causing erratic price jumps.
When trading smaller altcoins, the momentum stack may generate signals that are technically valid but practically untradeable due to low volume. A "perfect" chart pattern on a coin with $5,000 in daily volume is often a mirage. Stick to assets with sufficient liquidity to ensure that the technical signals you are seeing are representative of genuine market sentiment.
Contextualizing with Moving Averages
To further refine the strategy, traders often overlay simple moving averages (SMAs) on the price chart itself. While MACD uses moving averages in its calculation, seeing the raw 50-day and 200-day lines on the chart provides instant macro context. These lines act as dynamic support and resistance levels that the entire market watches closely.
The interaction between these two major averages creates powerful long-term signals. The "Golden Cross" occurs when the 50-day SMA crosses above the 200-day SMA. This is a major bullish signal indicating a long-term uptrend. The "Death Cross" is the opposite, signaling a long-term bear market. Knowing where the price sits relative to these lines helps you weight your stack signals appropriately.
The Golden Cross Context
If the market has recently experienced a Golden Cross, the bias is heavily bullish. In this environment, the momentum stack should be used primarily to find long entries. Short signals generated by the stack should be viewed with extreme skepticism or ignored entirely, as shorting a bull market is a high-risk strategy. The macro trend serves as a wind at your back.
When the price pulls back to touch the 50-day or 200-day moving average during a Golden Cross phase, and your momentum stack aligns (MACD positive, RSI resetting, Stochastic crossing up), the probability of a successful trade increases exponentially. These areas where multiple technical factors converge are known as "confluence zones."
The Bearish Cross Warning
Conversely, if a Bearish Cross (Death Cross) has occurred, the long-term trend is down. In this scenario, the stack is best used to identify shorting opportunities or to exit holding positions during relief rallies. Buying dips becomes dangerous because the "dip" often turns into a lower low. The moving averages will likely act as resistance, capping any upward moves.
Understanding this macro context prevents you from trying to catch falling knives. Even if the RSI is oversold, if the price is crashing below a declining 200-day moving average, the momentum is overwhelmingly negative. The indicators might stay oversold for weeks. In this case, the moving average context overrides the oscillator signals, saving you from entering a losing position.
Risk Management and Psychology
Even the best confirmation stack is not a crystal ball. Technical indicators rely on historical data, and they cannot predict black swan events, regulatory news, or sudden market shifts. Therefore, risk management is the safety net that protects you when the analysis fails. No trade should ever be entered without a clear plan for where to exit if the market moves against you.
Stop-loss orders are essential tools for preserving capital. A stop-loss is a preset order to sell an asset when it reaches a certain price. By placing a stop-loss below a recent support level or swing low, you define your maximum loss before the trade begins. This removes the need to make emotional decisions in the heat of the moment when prices are dropping rapidly.
Position Sizing
Position sizing is just as important as entry timing. It involves determining how much of your total portfolio to allocate to a single trade. Even with a high-probability setup using the momentum stack, you should never go "all in." A common rule is to risk only a small percentage (e.g., 1-2%) of your total capital on any single trade.
Proper sizing ensures that a string of losses does not wipe out your account. If you have a losing streak—which happens to every trader—your portfolio remains intact, allowing you to continue trading until the probabilities swing back in your favor. Position sizing allows you to weather the inevitable volatility of the crypto market without facing financial ruin.
Emotional Discipline
The psychology of trading is often the hardest hurdle to clear. It is easy to look at a chart and say you will wait for the MACD, RSI, and Stochastic to align. It is much harder to actually sit on your hands for days or weeks while the market moves erratically. The fear of missing out (FOMO) drives traders to jump in early, abandoning their rules.
Successful use of the confirmation stack requires the discipline to act like a sniper, not a machine gunner. You must be willing to let sub-optimal trades pass by. If the Stochastic crosses but the MACD hasn't confirmed, you wait. If the price flies up without a signal, you let it go. The market will always offer another opportunity. Sticking to your criteria protects you from impulsive, emotional gambling.
Conclusion
The Momentum Confirmation Stack offers a structured approach to navigating the complex world of cryptocurrency trading. By combining the trend-identifying power of the MACD, the internal strength gauging of the RSI, and the precision timing of the Stochastic Oscillator, traders can filter out noise and focus on high-probability setups. This layered approach ensures that trade decisions are based on a confluence of data points rather than isolated signals.
However, technical analysis is a tool for probability, not certainty. Even the most perfect alignment of indicators requires confirmation from trading volume and an awareness of the broader market context provided by moving averages. Furthermore, no strategy eliminates the need for strict risk management. Stop-losses, position sizing, and emotional discipline remain the bedrock of long-term survival in the markets.
Success in trading comes not from predicting every move, but from waiting patiently for the few moves where the odds are heavily in your favor.