
Successful trading requires more than just intuition or following the latest news headlines. It demands a structured approach that filters out market noise and identifies high-probability opportunities. Building a trend-following system allows traders to align themselves with the dominant momentum of the market rather than fighting against it. By leveraging technical analysis tools, investors can construct a framework that objectively analyzes price action, gauges trend strength, and pinpoints optimal entry and exit levels. This systematic approach reduces emotional decision-making and fosters consistency.
The core of any robust trading system lies in its ability to decipher complex market data into actionable signals. Cryptocurrency markets are known for their volatility and rapid price shifts, making it essential to have tools that smooth out fluctuations and reveal the underlying direction. Moving averages and momentum indicators serve as the foundational building blocks for this purpose. They provide a historical perspective on price behavior, allowing traders to spot developing trends early and ride them until signs of exhaustion appear.
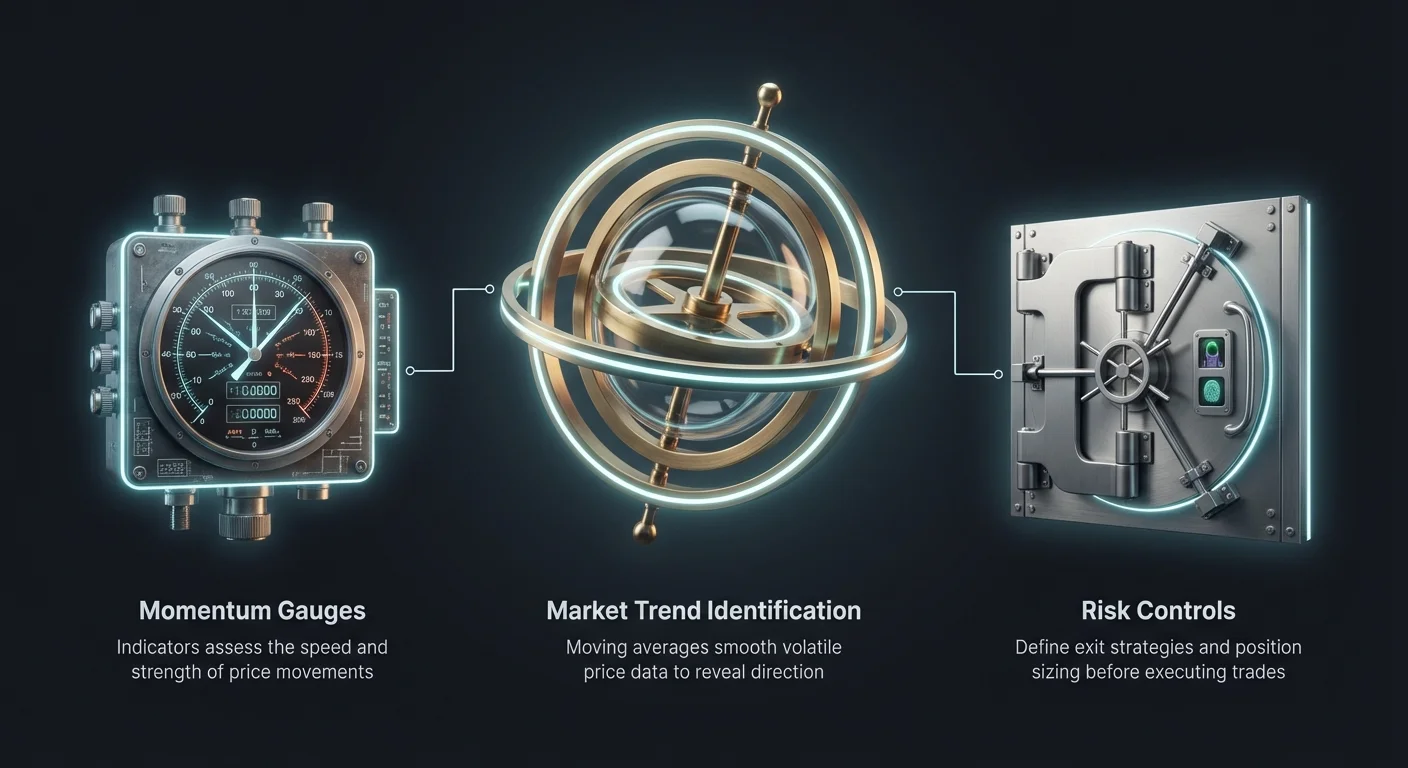
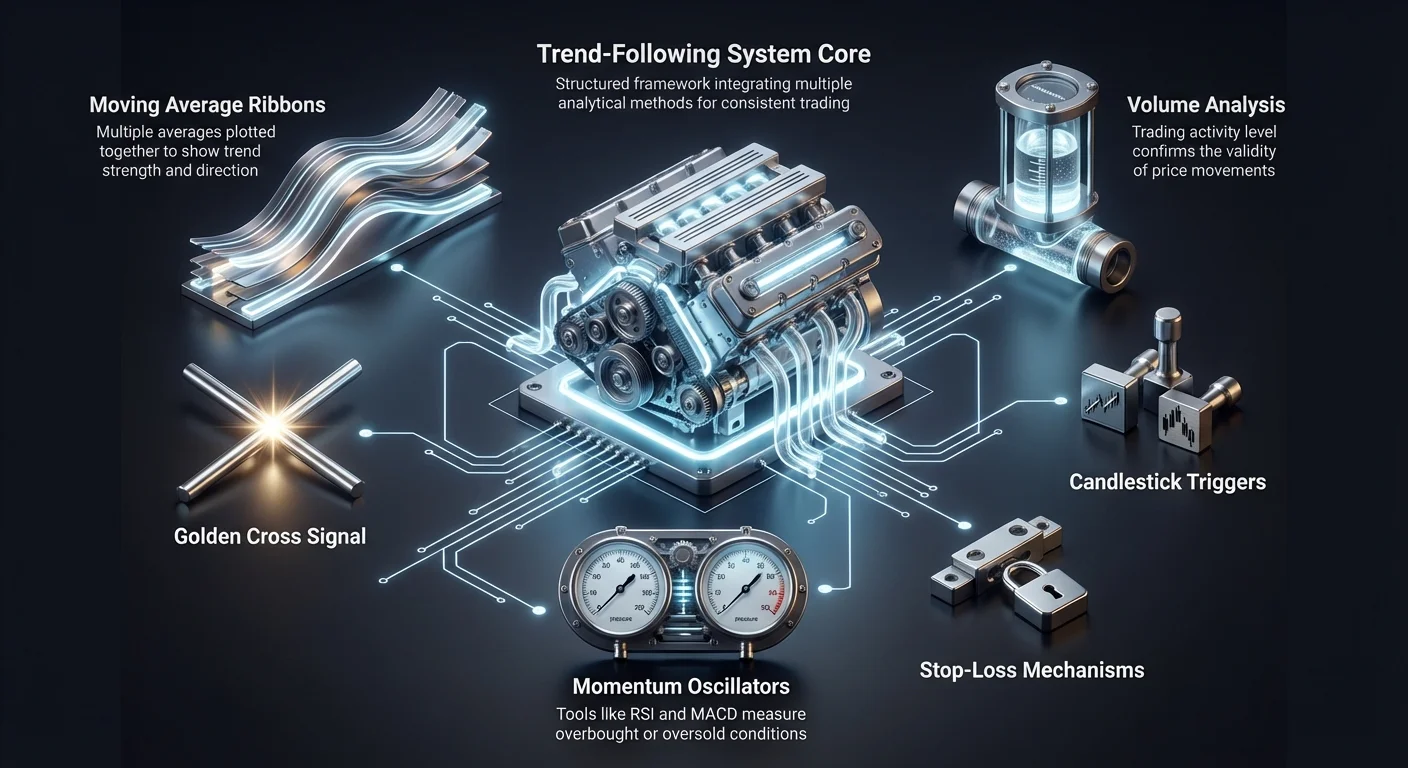
Developing a comprehensive strategy involves layering multiple analytical methods to confirm signals. Relying on a single indicator can often lead to false positives, especially in choppy or sideways markets. By combining trend identifiers with momentum gauges and volume analysis, traders create a system of checks and balances. This holistic view ensures that a trade is not just based on a fleeting price spike but is supported by broader market participation and structural strength.
The Foundation of Trend Analysis
Technical analysis operates on the premise that historical price data can provide insights into future movements. At the heart of this discipline are charts, which visually represent the battle between buyers and sellers over specific timeframes. Understanding chart mechanics is the first step in building a trend-following system. Whether using line charts for a simple overview or candlestick charts for detailed price action, the goal remains the same. Traders must identify whether the market is making higher highs and higher lows, indicating an uptrend, or lower highs and lower lows, signaling a downtrend.
Timeframes play a critical role in this analysis. A trend visible on a 15-minute chart may be just a minor correction within a larger trend on a weekly chart. Long-term investors typically focus on daily or weekly timeframes to capture broader market moves, while day traders zoom in on hourly or minute-based charts to exploit short-term volatility. A robust system often analyzes multiple timeframes simultaneously. This technique ensures that short-term entries align with the major long-term direction, increasing the probability of success.
Interpreting Market Psychology
Charts are ultimately a reflection of human psychology and market sentiment. Every price movement represents the collective actions of fear, greed, optimism, and pessimism among participants. Technical analysis attempts to quantify these emotions through patterns and indicators. When a resistance level breaks, it signals that buyers have overwhelmed sellers, reflecting a shift in psychology from caution to confidence. Conversely, when support fails, fear has taken over, driving participants to exit their positions.
Fundamental analysis complements this technical view by assessing the intrinsic value of an asset. In cryptocurrency, this involves evaluating network adoption, transaction volume, and technological upgrades. While technicals tell you when to trade, fundamentals often explain why a trend might exist. A trend-following system that acknowledges fundamental drivers can often filter out weak technical signals that lack real-world substance. Combining these approaches provides a 360-degree view of the market landscape.
Mastering Moving Averages and Ribbons
Moving averages (MAs) are the primary tools for smoothing out price data to reveal the true trend direction. A moving average calculates the average price of an asset over a specific number of periods, creating a flowing line that follows the price action. In a trend-following system, these lines act as dynamic support and resistance levels. When the price is above a key moving average, the trend is generally considered bullish. When below, the trend is bearish.
Traders often use a combination of moving averages to create a "ribbon" effect. This involves plotting multiple MAs of varying lengths on a single chart. For example, a system might utilize a short-term 50-day MA alongside a long-term 200-day MA. The interaction between these lines provides powerful signals. When the shorter-term averages stack neatly above the longer-term ones, the trend is strong and established. If the lines begin to compress or twist, it suggests the trend is weakening or a reversal is imminent.
The Golden Cross Phenomenon
One of the most widely recognized signals in trend following is the Golden Cross. This pattern occurs when a short-term moving average, typically the 50-day, crosses above a long-term moving average, such as the 200-day. This crossover signifies a decisive shift in momentum. It indicates that recent buying pressure is outpacing the average sentiment of the past several months. Historically, this pattern has preceded significant bull markets in both traditional and crypto assets.
Traders view the Golden Cross as a confirmation signal rather than a prediction. It validates that a downtrend has ended and a new accumulation phase has likely begun. Entry strategies often involve buying as the cross occurs or waiting for a retest of the moving averages as support. Stop-loss orders are frequently placed below the 200-day MA to protect capital in case the signal proves false. This setup provides a clear, objective rule for entering long-term trends.
The Death Cross and Bearish Reversals
The counterpart to the Golden Cross is the Death Cross. This bearish signal forms when the 50-day moving average crosses below the 200-day moving average. It suggests that short-term momentum is deteriorating and that the long-term trend is turning negative. For trend followers, identifying a Death Cross is crucial for asset protection. It serves as a warning to reduce exposure, tighten stop losses, or exit positions entirely to avoid substantial drawdowns.
False signals can occur with both crosses, particularly in sideways or "choppy" markets where prices fluctuate within a narrow range. In such environments, moving averages may crisscross repeatedly without a sustained trend developing. This results in "whipsaw" trades where positions are stopped out for losses. To mitigate this, traders look for additional confirmation factors such as high trading volume or fundamental catalysts before acting on a cross signal.
Advanced Cycle Indicators
Beyond the standard 50 and 200-day averages, specific crypto-native indicators like the Pi Cycle Top offer unique insights. This tool uses a 111-day moving average and a multiple of the 350-day moving average to identify overheated market conditions. When the shorter-term average crosses above the longer-term multiple, it has historically signaled a cycle peak within days. Incorporating these specialized MAs into a ribbon system adds a layer of cycle awareness that standard indicators might miss.
Gauging Trend Strength and Momentum
Identifying a trend is only half the battle; determining its strength is equally important. A weak trend is prone to frequent reversals, while a strong trend can persist despite minor pullbacks. Momentum indicators help traders assess the velocity of price movements and determine if a trend has enough energy to continue. These tools oscillate within a set range and provide objective readings on whether an asset is overbought or oversold.
Indicators like the Relative Strength Index (RSI) and the Moving Average Convergence Divergence (MACD) act as the engine room of a trend-following system. They look under the hood of price action to measure the intensity of buyer and seller activity. When price makes a new high but momentum indicators fail to follow suit, it creates a divergence. This discrepancy is a powerful warning sign that the current trend is losing steam and a reversal may be on the horizon.
The Role of Trading Volume
Volume is the fuel that drives market trends. It represents the total amount of an asset traded over a specific period and serves as a truth-teller for price moves. A breakout accompanied by a surge in trading volume confirms that major market participants are supporting the move. High volume during an uptrend suggests strong accumulation and conviction. Conversely, a price rise on low volume indicates a lack of interest, warning that the trend is fragile and likely to collapse.
Analyzing volume patterns helps distinguish between genuine trend shifts and deceptive traps. In a healthy trend, volume should increase in the direction of the trend and decrease during consolidations. If an asset falls in price but volume spikes significantly, it may indicate a "climax" or capitulation event, often marking a bottom. Integrating volume analysis ensures that a trading system is aligned with the flow of capital rather than just surface-level price changes.
Using the MACD for Signal Confirmation
The MACD is a versatile tool that tracks the relationship between two exponential moving averages. It consists of a MACD line, a signal line, and a histogram. When the MACD line crosses above the signal line, it generates a bullish alert, suggesting upward momentum is building. A cross below the signal line indicates bearish pressure. The histogram visually represents the distance between the two lines, expanding as momentum strengthens and contracting as it fades.
Traders use the MACD to verify the signals generated by moving average ribbons. If a Golden Cross occurs, seeing the MACD line rise above zero strengthens the bullish case. Additionally, the MACD is excellent for spotting divergences. A bullish divergence occurs when price makes a lower low while the MACD makes a higher low, hinting that selling pressure is exhausted. This nuance allows trend followers to enter positions before the moving averages fully cross, securing a better entry price.
RSI and Stochastic Oscillators
The Relative Strength Index (RSI) measures the speed and change of price movements, oscillating between 0 and 100. Readings above 70 typically suggest an asset is overbought, while readings below 30 indicate it is oversold. In a strong trend, however, assets can remain overbought for extended periods. Therefore, in a trend-following system, RSI is often used to time entries on pullbacks. During an uptrend, a dip in RSI to 40 or 50 can signal a buying opportunity within the broader rising trend.
The Stochastic Oscillator functions similarly but focuses on closing prices relative to the high-low range. It consists of two lines, %K and %D. Crossovers between these lines in overbought or oversold zones provide actionable signals. For instance, a bullish crossover in the oversold region confirms that downward momentum has paused and buyers are stepping back in. Combining RSI and Stochastic readings helps filter out noise and pinpoint precise turning points within the trend.
Precision Entries with Candlestick Patterns
While indicators provide the roadmap, candlestick patterns offer the specific trigger for executing a trade. Candlesticks provide a detailed view of price action within a single time period, showing the open, high, low, and close. The shape and color of the candle reveal the immediate struggle between bulls and bears. Recognizing these patterns allows traders to time their entries with greater precision, minimizing drawdown and improving risk-to-reward ratios.
Patterns such as the "Hammer" or "Bullish Engulfing" are particularly potent when they appear near key support levels or moving averages. A Hammer features a small body and a long lower wick, indicating that sellers pushed the price down, but buyers rejected the lower levels and closed the session strong. This reversal signal, when aligned with a trend-following indicator, provides a high-confidence entry point.
Reversal and Continuation Patterns
Candlestick analysis identifies two main types of setups: reversals and continuations. Reversal patterns, like the "Shooting Star" or "Evening Star," suggest that the current trend is ending. These are vital for trend followers to recognize, as they often serve as exit signals or warnings to tighten stops. A Shooting Star at the top of a rally, combined with a bearish MACD cross, is a strong indication to lock in profits.
Continuation patterns signal that the market is simply pausing before resuming the trend. Formations like flags or pennants often appear during healthy consolidations. In these scenarios, traders look for specific candles, such as the "Three White Soldiers" or a strong breakout candle, to confirm that the trend is resuming. By waiting for these visual confirmations, traders avoid entering during the choppy middle phase of a correction.
Heikin-Ashi for Smoother Trends
For traders who find standard candlesticks too noisy, Heikin-Ashi charts offer a smoother alternative. These charts use a modified formula to calculate the average price of a candle, filtering out minor fluctuations. In a strong uptrend, Heikin-Ashi candles will appear continuously green with no lower wicks, visually confirming the strength of the trend. This clarity makes it easier to stay in a winning trade without being shaken out by insignificant intraday volatility.
| Pattern Type | Signal Name | Description |
|---|---|---|
| Reversal | Hammer | Bullish rejection of lower prices; long lower wick. |
| Reversal | Shooting Star | Bearish rejection of higher prices; long upper wick. |
| Continuation | Green Heikin-Ashi | Series of green candles with no lower wicks. |
Risk Management and Trading Psychology
No trading system is complete without a rigorous risk management framework. Crypto markets are inherently volatile, and even the best technical setups can fail due to unforeseen news or market manipulation. Risk management is the defensive layer that ensures a trader survives a losing streak to trade another day. It involves setting clear rules for position sizing, stop-loss placement, and portfolio allocation before a trade is ever executed.
Volatility is a double-edged sword. While it provides the price movement necessary for profits, it also increases the likelihood of hitting stop losses prematurely. Understanding metrics like standard deviation helps traders gauge the expected range of price movement. In highly volatile conditions, traders may reduce their position size to account for wider stop-loss requirements, keeping their total risk per trade constant.
Effective Stop-Loss Strategies
A stop-loss is an automated order to sell an asset if it reaches a certain price, limiting potential losses. In a trend-following system, stop losses are often placed below key structural levels, such as the 200-day moving average or a recent swing low. As the trend progresses, traders employ "trailing stops," moving the exit level upward to lock in accumulated profits. This ensures that a winning trade does not turn into a loser if the market suddenly reverses.
Position sizing is equally critical. Allocating a fixed percentage of the portfolio to each trade prevents a single bad decision from wiping out significant capital. Professional traders typically risk only 1% to 2% of their total account balance on any single setup. This discipline removes the pressure to be right on every trade, shifting the focus to long-term expectancy rather than short-term gambling.
Controlling Emotions and Psychology
Trading psychology is often the most challenging aspect of implementing a system. Fear and greed can drive traders to abandon their rules, chasing pumps at the top or panic-selling at the bottom. A trend-following system is designed to counter these impulses by providing objective entry and exit criteria. When a decision is based on a moving average cross or an RSI signal, it removes the emotional weight of the choice.
FOMO, or the Fear Of Missing Out, is a common pitfall in crypto. Seeing an asset skyrocket can tempt traders to enter without a valid setup, often leading to buying the top. Conversely, panic during a correction can cause premature exits from healthy trends. Adhering to a written plan helps maintain emotional discipline. Successful traders accept that losses are part of the process and focus on executing their system flawlessly rather than stressing over the outcome of individual trades.
Synthesizing the System
Building a cohesive trend-following system involves integrating the components of structure, momentum, and execution. The process begins with the high-level view provided by moving averages. A trader might start by checking the daily chart to see if the price is above the 200-day MA and if a Golden Cross has recently occurred. This confirms the bias is bullish and that long positions are favored over short ones.
Once the trend direction is established, the focus shifts to gauging strength using volume and momentum indicators. A trader looks for the MACD to be positive and for RSI to be in a healthy range, perhaps bouncing off the 50 midline. Volume should be rising on upward moves. If these conditions are met, the system scans for a specific trigger, such as a Bullish Engulfing candle on the 4-hour chart or a breakout from a consolidation pattern.
Monitoring and Exiting
The final phase of the system is trade management and exiting. A trend follower holds the position as long as the structural arguments remain valid. If the price remains above the chosen moving average ribbon and heikin-ashi candles remain green, the trade is active. Exits are triggered when the system detects weakness, such as a Death Cross, a bearish divergence on the RSI, or a close below a key support level.
Regularly reviewing trades is essential for system refinement. Keeping a trading journal allows investors to analyze which signals yielded the best results and which led to losses. Over time, this feedback loop helps fine-tune the parameters, such as adjusting the moving average lengths or volume thresholds, to better suit specific market conditions. Continuous learning and adaptation are the hallmarks of a sustainable trading career.
Conclusion
Constructing a trend-following system is a journey of combining technical precision with disciplined execution. By utilizing moving averages to define the battlefield, volume and momentum indicators to gauge the strength of the forces involved, and candlestick patterns to time the attack, traders can navigate the complexities of the crypto market with confidence. This structured approach transforms trading from a game of guessing into a professional endeavor based on probability and logic.
Ultimately, the tools discussed—from the Golden Cross to the Stochastic Oscillator—are merely instruments. The true power of the system lies in the trader's ability to apply them consistently, manage risk effectively, and remain emotionally balanced during market turbulence. Success comes not from predicting the future, but from reacting intelligently to the present reality of price action.
Consistency and discipline are the true drivers of long-term trading success.