
Technical analysis in the cryptocurrency market is built on the study of probability rather than certainty. Traders spend countless hours learning to identify classic formations like the Rising Hammer or the Shooting Star. These patterns are designed to signal potential reversals where the balance of power shifts between buyers and sellers. However, veteran market participants understand a harsh reality regarding these setups. They do not always work as intended.
Market conditions, sudden volatility, or a lack of volume can cause even the most textbook candlestick pattern to fail. A "failed pattern" occurs when the anticipated price movement does not materialize following a confirmed signal. Instead of reversing, the trend continues, or the price moves aggressively in the opposite direction of the forecast. While this can be frustrating for novice traders, experienced operators view these failures differently.
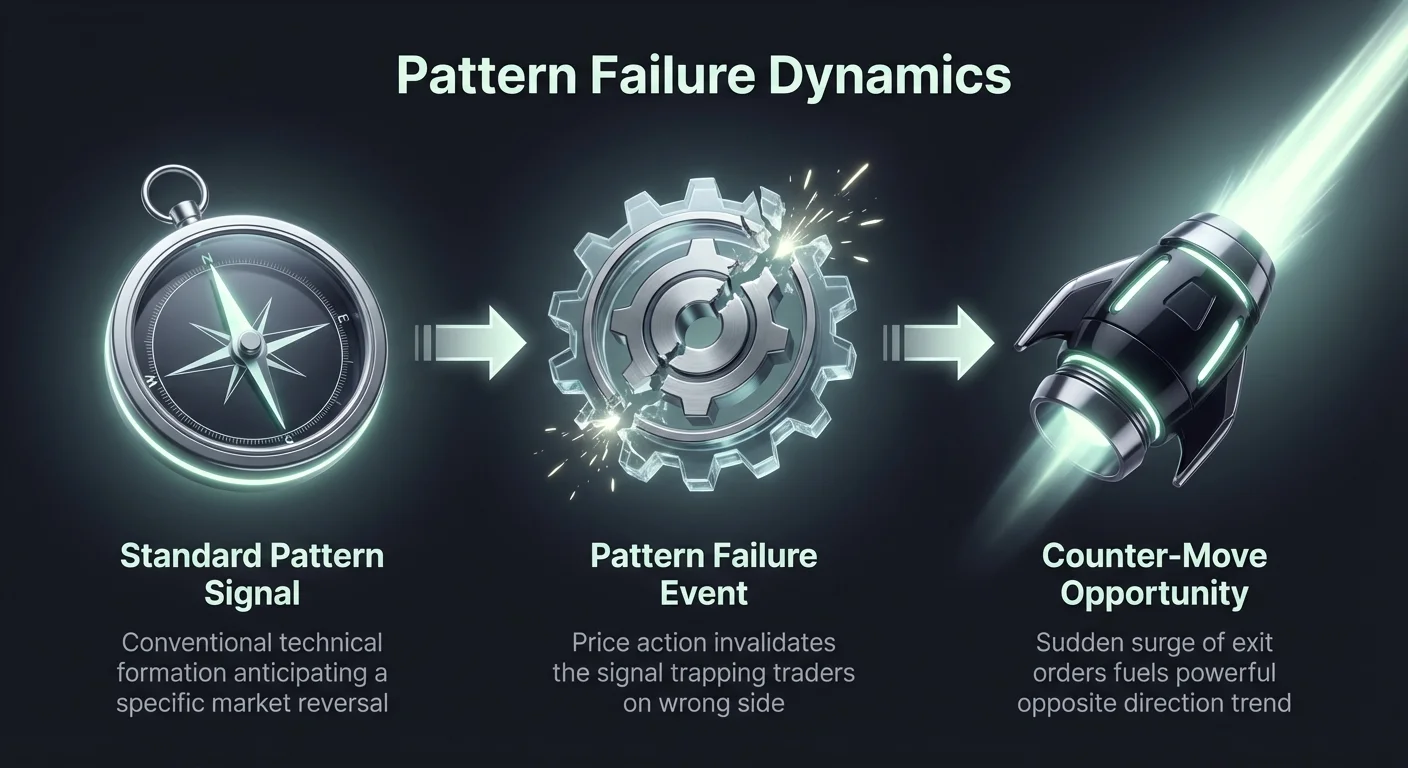
A failed pattern is not merely a losing trade. It is a specific signal in itself. When a widely recognized pattern breaks down, it often indicates that a significant number of traders are trapped on the wrong side of the market. This realization forces them to exit their positions simultaneously. This sudden surge of exit orders can fuel a powerful move in the opposite direction. Recognizing these failures offers a distinct edge in risk management and trade execution.
The Psychology Behind Pattern Failures
Understanding why patterns fail requires looking at the market through the lens of liquidity and order flow. Every standard candlestick pattern tells a story about the battle between bulls and bears. For instance, a bullish reversal pattern suggests that buyers have successfully absorbed selling pressure. If price action subsequently invalidates that pattern, it implies that the buying support was illusory or temporary.
When a pattern fails, the psychological impact on market participants is immediate. Traders who entered early based on the standard signal are instantly put under pressure. As the price moves against the pattern, these traders reach their pain points. Their stop-loss orders are triggered, which acts as fuel for the counter-move. Understanding this sequence of events allows astute traders to capitalize on the momentum generated by these forced exits.
Analyzing the Failed Rising Hammer
The Rising Hammer, or bullish hammer, is a classic signal that forms after a sustained downtrend. According to technical theory, this single-candle pattern indicates that sellers pushed the price down significantly during the session. However, buyers stepped in to push the price back up near the open. This creates a long lower wick and a small real body.
The standard interpretation is that the downtrend is losing steam. Traders expect a reversal and often enter long positions. They typically place their stop losses just below the lowest point of the hammer's wick. This concentration of stop orders creates a pool of liquidity that institutional traders or market volatility can target. A failure occurs when the market ignores the bullish rejection and pushes lower.
Identifying the Hammer Breakdown
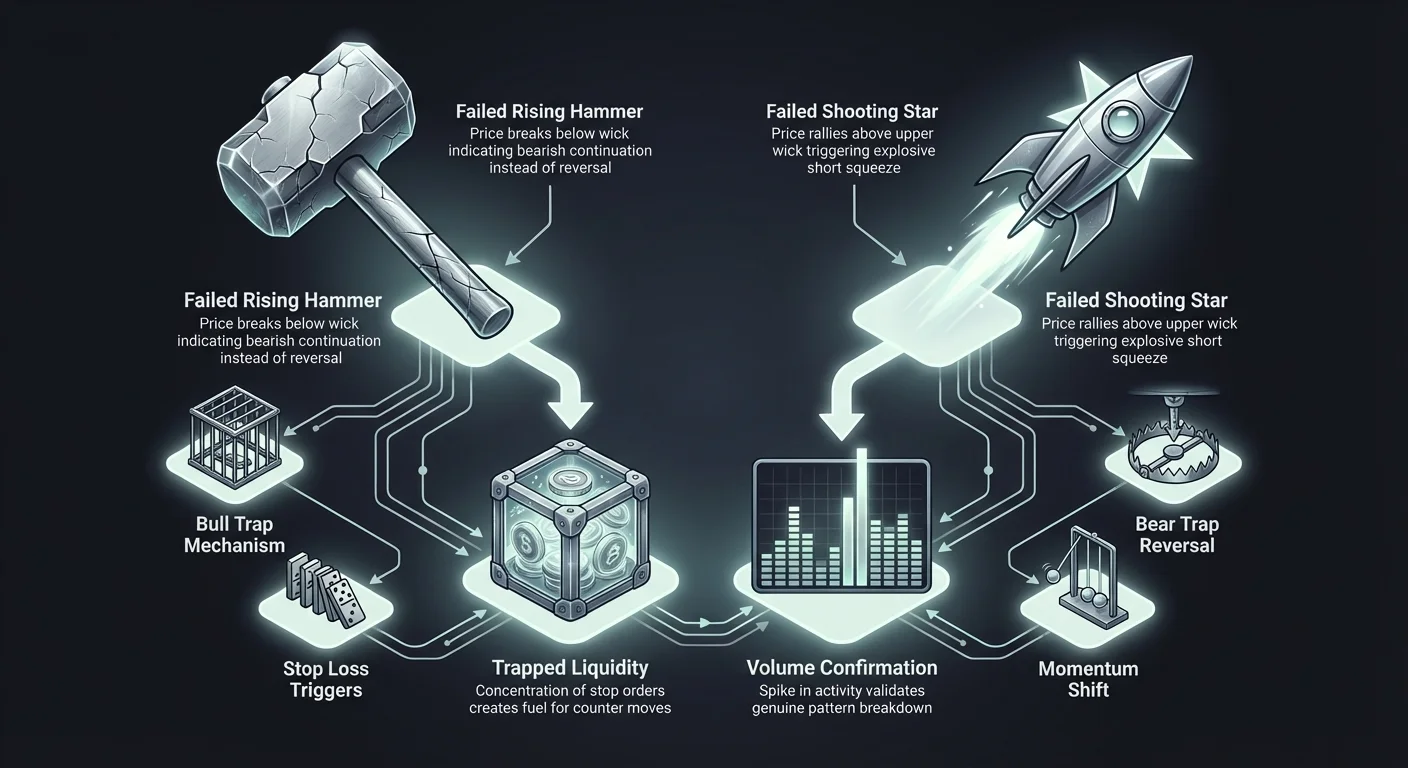
A failed Rising Hammer is easy to spot if you know what to look for. First, you must identify a valid hammer formation following a clear decline in price. The lower shadow should be at least two to three times the length of the body. Once identified, the focus shifts to the subsequent price action. A failure is confirmed when a following candle closes significantly below the lowest point of the hammer's wick.
This breakdown signals that the buying pressure observed during the hammer's formation was insufficient to turn the tide. The "smart money" or aggressive sellers have overwhelmed the dip buyers. When the low of the hammer is breached, the stop losses from the bullish traders are triggered. This creates a cascade of sell orders.
| Component | Standard Signal | Failed Signal |
|---|---|---|
| Context | After downtrend | After downtrend |
| Key Feature | Long lower wick | Price closes below wick |
| Implication | Bullish Reversal | Bearish Continuation |
Trading the Hammer Failure
Trading the failure of a Rising Hammer involves going with the prevailing downtrend rather than betting on a reversal. Instead of buying the dip, a trader observes the support level marked by the hammer's wick. If the price breaks this level with high volume, it suggests the downtrend is resuming with vigor.
In this scenario, the failed hammer serves as a bearish continuation signal. The logic is that the market attempted to rally and failed miserably. This failure demonstrates that bearish sentiment is still dominant. Traders might enter short positions upon a confirmed close below the hammer, using the top of the hammer candle as a conservative stop-loss level to manage risk.
The Shooting Star Trap
The Shooting Star is the bearish counterpart to the hammer. It appears after an uptrend and features a long upper wick with a small body near the bottom of the candle range. This pattern suggests that buyers pushed the price up, but sellers aggressively rejected those higher prices by the close. It is traditionally viewed as a sign to sell or exit long positions.
A failed Shooting Star is a powerful bullish signal often referred to as a "bust." This occurs when the price ignores the selling pressure indicated by the upper wick and continues to rise. The failure of this bearish pattern often leads to explosive upward moves due to the "short squeeze" phenomenon.
Mechanics of the Short Squeeze
When a Shooting Star forms, bearish traders enter short positions. They anticipate that the market top is in. They place their protective stop-loss orders just above the highest point of the Shooting Star's upper wick. If the market refuses to go down and instead rallies to break that high, those short traders are trapped.
As the price breaches the high of the Shooting Star, stop-loss buy orders are triggered. This buying pressure is added to the organic buying demand from trend followers. The result is often a rapid, high-momentum candle that extends the uptrend. Recognizing this failure allows traders to align themselves with the enduring strength of the market rather than trying to call a top prematurely.
Confirmation of the Failed Star
To trade a failed Shooting Star, patience is essential. You must first confirm the presence of a valid Shooting Star pattern after a strong uptrend. The failure is triggered only when a subsequent candle closes above the high of the Shooting Star. This confirms that the sellers who attempted to reverse the trend have been overpowered.
Volume plays a critical role here. A low-volume Shooting Star followed by a high-volume breakout above its wick is a high-probability setup. It indicates that the initial rejection lacked conviction. The subsequent breakout represents a renewed wave of buying interest. Traders can use this "bust" pattern to enter fresh long positions or add to existing ones.
Engulfing Pattern Fakeouts
Engulfing patterns are two-candle formations that signal a strong shift in momentum. A Bullish Engulfing pattern consists of a red candle followed by a larger green candle that completely covers the previous body. Conversely, a Bearish Engulfing pattern features a green candle enveloped by a larger red one. These are popular signals because they visually represent one side overpowering the other.
However, engulfing patterns are prone to failure, especially in choppy or sideways markets. A failed engulfing pattern creates a "trap" scenario. For example, a Bullish Engulfing pattern may form at support, inducing traders to buy. If the very next candle immediately reverses and closes below the low of the engulfing pattern, the bulls are trapped.
The Bull Trap Breakdown
A failed Bullish Engulfing pattern is a severe warning sign. It suggests that the market generated a strong buy signal that was immediately rejected. This often happens during "dead cat bounces" in a larger bearish trend. The green engulfing candle lures in hopeful buyers who believe the bottom is in.
When the price undercuts the low of that bullish candle, it proves that the selling pressure is relentless. The optimism was misplaced. Traders can use this failure to identify high-probability short entries. The failure of such a strong bullish signal often leads to a swift retesting of lower support levels or the creation of new lows.
The Bear Trap Reversal
On the flip side, a Bearish Engulfing pattern that fails can launch a massive rally. Imagine an uptrend where a large red candle engulfs the previous green one. This looks like a scary reversal. Traders rush to sell or short the asset. However, if the price does not follow through to the downside and instead breaks back above the high of the engulfing candle, the bears are caught.
This scenario implies that the market absorbed a significant selling event and remained standing. The inability of the Bearish Engulfing pattern to push prices lower demonstrates underlying strength. Traders identifying this failure can enter long positions with the confidence that a major supply pocket has been exhausted.
| Pattern | Standard View | Failure Condition | Result |
|---|---|---|---|
| Bullish Engulfing | Buyers take control | Price breaks pattern low | Bearish continuation |
| Bearish Engulfing | Sellers take control | Price breaks pattern high | Bullish continuation |
Breakdowns of Three-Candle Patterns
Three-candle patterns like the Morning Star and Evening Star are considered more reliable than single-candle patterns because they unfold over time. They typically involve a trend candle, a moment of indecision (the star), and a reversal candle. The complexity of these patterns makes their failure even more significant.
A Morning Star is a bottoming pattern. It starts with a big red candle, then a small indecision candle, and finally a strong green candle. It signals a new uptrend. A failure occurs if the price drops below the low of the middle "star" candle shortly after the pattern completes. This invalidation is devastating for bulls because it breaks a confirmed reversal structure.
Invalidating the Morning Star
When a Morning Star fails, it indicates that the market pause was merely a consolidation before another leg down. The psychological implication is that buyers attempted to build a base and failed. The breaking of the star's low signifies that the support level has collapsed.
Traders watching for this failure should monitor the low point of the middle candle. This is the invalidation line. If the price closes below this level, the bullish thesis is void. This often accelerates the downtrend as traders who trusted the three-candle confirmation are forced to liquidate their positions.
The Evening Star Continuation
The Evening Star is a topping pattern found during uptrends. It transitions from bullishness to indecision to bearishness. Traders use it to spot the start of a decline. However, in strong bull markets, an Evening Star can form and then immediately fail. This happens when the price rallies back above the high of the middle star candle.
This failure indicates that the market simply took a breather before resuming its upward trajectory. The bearish reversal candle was essentially a "bear trap." Once the high is breached, the uptrend often resumes with increased momentum. The failed Evening Star acts as a consolidation flag rather than a reversal top.
Risk Management and Confirmation Tools
Identifying failed patterns is a strategy that requires strict risk management. The nature of trading these setups involves entering when others are exiting. While this can be profitable, it is also volatile. You are effectively betting against the textbook definition of technical analysis. Therefore, confirmation is vital before executing a trade based on a pattern failure.
You should never assume a pattern will fail before it actually does. Anticipating a failure can lead to unnecessary losses if the standard pattern plays out as intended. Always wait for the price to breach the key high or low levels (the wicks or bodies) that invalidate the pattern.
Utilizing Volume Analysis
Volume is a primary tool for confirming pattern failures. In a standard successful pattern, volume should increase in the direction of the new trend. For a failed pattern, look for volume anomalies. For example, if a Bearish Engulfing pattern forms on weak volume, it is more likely to fail.
Conversely, if the breakout that invalidates the pattern is accompanied by a surge in volume, the failure signal is genuine. High volume during a breakdown indicates that stop losses are being triggered and new money is entering the market in the opposite direction. This validates the trap.
RSI and Momentum Context
Technical indicators like the Relative Strength Index (RSI) provide context for potential failures. A pattern is more likely to fail if it contradicts the momentum shown by the RSI. For instance, a Bearish Shooting Star might form, but if the RSI is not in overbought territory and shows no bearish divergence, the uptrend may still have room to run.
Similarly, a Bullish Hammer forming in a market where the RSI is trending aggressively downward might be a false signal. If the momentum indicator suggests the trend is still strong, the likelihood of the candlestick pattern failing increases. Using these tools helps filter out low-probability setups.
| Indicator | Role in Failure Analysis | What to Look For |
|---|---|---|
| Volume | Confirming Breakouts | Spike on pattern invalidation |
| RSI | Momentum Context | Lack of divergence |
| Support/Res | Structural Areas | Pattern forming in "no man's land" |
Strategic Entries on Failures
Trading failed patterns requires a counter-intuitive approach to entry placement. Standard advice tells traders to place entries confirming the pattern. For failure trading, you are looking for the exact opposite trigger. The entry point is typically the price level where the standard trade is proven wrong.
For a failed bearish pattern, the buy entry is just above the pattern's high. For a failed bullish pattern, the sell entry is just below the pattern's low. These levels are critical because they represent the point of maximum pain for the trapped traders.
Setting Stop Losses
Risk management remains the cornerstone of longevity in crypto trading. When trading a failed pattern, your stop loss should be placed just inside the range of the failed pattern. You do not need to give the trade massive room to breathe. The thesis is based on a trap. If the price moves back into the pattern range, the trap may not be effective.
For example, if you go long on a failed Shooting Star, your stop loss could be placed below the body of the star candle. If the price falls back below that body, the bullish breakout might have been a fakeout itself. Keeping stops tight ensures that if the chaotic market conditions produce a "whipsaw," your losses remain small and manageable.
The Role of Market Sentiment
Crypto markets are heavily influenced by sentiment. Failed patterns often occur during periods of extreme euphoria or panic. In a raging bull market, bearish reversal patterns like Shooting Stars or Evening Stars fail frequently. The buying pressure is simply too immense to be stopped by a single technical formation.
Recognizing the broader market regime is crucial. In a strong trending market, betting on reversal patterns to fail is often a higher probability play than betting on the reversal itself. By aligning your trades with the dominant trend and using failed reversals as entry signals, you utilize the market's momentum to your advantage.
Conclusion
Mastering the identification of failed candlestick patterns adds a sophisticated layer to a trader's technical analysis toolkit. While standard patterns like the Rising Hammer, Shooting Star, and Engulfing formations are valuable, they are not infallible. In the volatile world of cryptocurrency, these signals often break down, creating traps for the unwary and opportunities for the observant. Recognizing when a bullish signal has morphed into a bearish continuation, or vice versa, allows traders to pivot quickly and capitalize on trapped liquidity.
The key to trading these breakdowns lies in understanding the psychology of the market participants involved. A failed pattern represents a mass exit of traders who were positioned on the wrong side of the move. By waiting for confirmation through price breaks and validating with volume or momentum indicators, traders can execute entries with favorable risk-to-reward ratios. This approach shifts the focus from predicting reversals to reacting to proven market strength or weakness.
True market insight comes not from predicting what should happen, but from knowing exactly how to profit when the probable outcome fails to materialize.