In the fast-paced and often volatile environment of cryptocurrency markets, price charts represent more than just lines and bars. They serve as a historical record of human emotion, capturing the constant tug-of-war between optimism and fear. Every data point on a chart tells a story of buyers and sellers clashing for dominance. Among the most powerful narrative tools in a trader's arsenal are the wicks and shadows attached to candlesticks. These thin lines often hold the key to understanding where value has been rejected and where the market intends to go next.
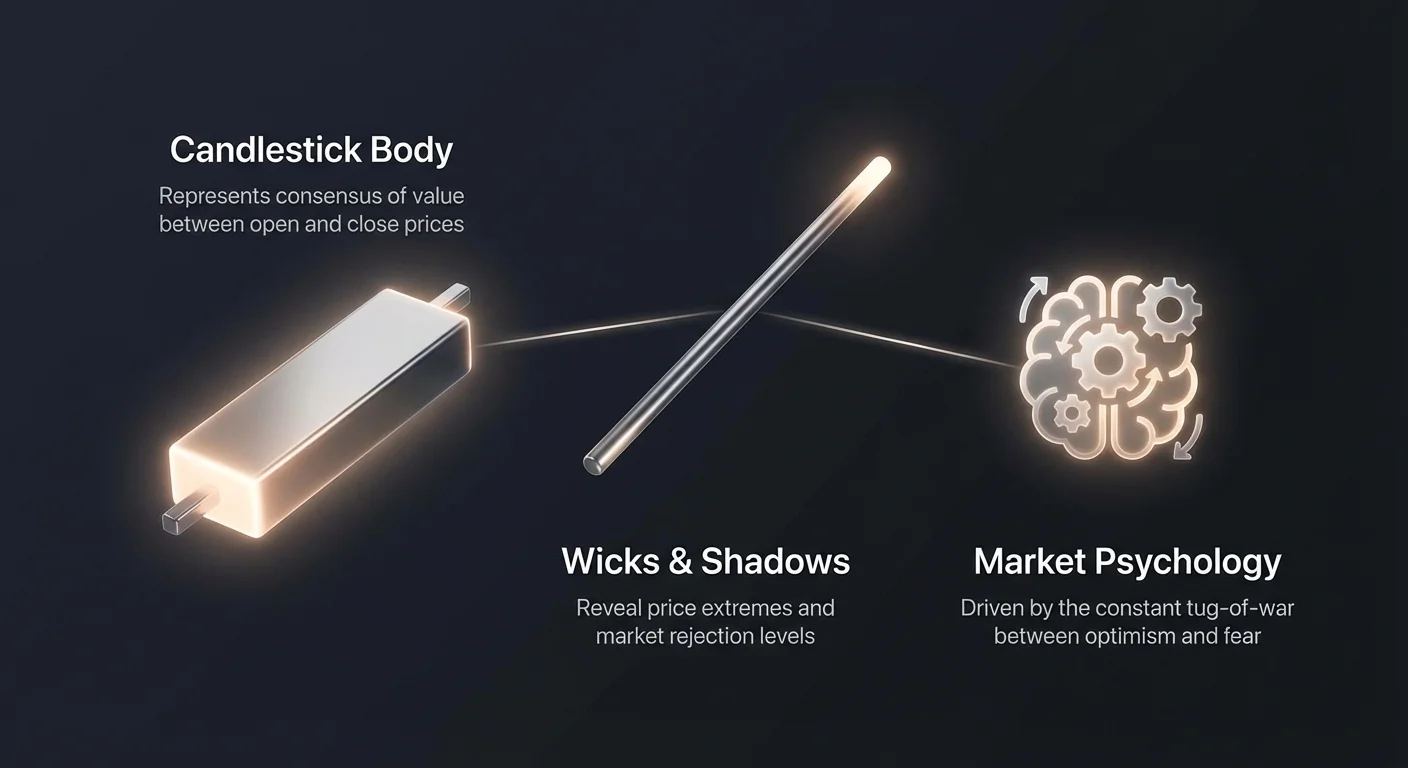
Understanding the anatomy of a candlestick is the first step toward decoding these signals. While the body of the candle shows the open and close prices, representing the consensus of value for that timeframe, the wicks reveal the extremes. They show how far buyers or sellers attempted to push the price before being forced back. A long wick is not merely a visual quirk. It is definitive proof that a specific price level was tested and subsequently rejected by the market participants.
This rejection is often the first sign of a reversal. When price pushes deep into a new high or low but fails to sustain that level by the time the candle closes, it indicates exhaustion. The momentum that drove the price to that extreme has faded, and the opposing force has stepped in to reclaim control. By mastering the interpretation of these extreme price rejections, traders can identify high-probability setups that others might miss.
The Psychology of Market Rejection
To trade wicks effectively, one must understand the psychology driving their formation. A long shadow indicates a failure of one side of the market to maintain control. If a candle has a long upper wick, it means buyers were aggressive early in the session. They pushed prices higher, likely triggering fear of missing out among novice traders. However, smart money or heavy supply zones stepped in, selling into that strength and driving the price back down.
Conversely, a long lower wick tells a story of failed capitulation. Sellers attempted to drive the market into the ground, perhaps triggering stop-losses or panic selling. Yet, by the end of the period, value buyers stepped in to absorb that liquidity. They pushed the price back up, leaving behind a "tail" that serves as evidence of strong demand.
These visual footprints allow traders to spot potential turning points before a full trend reversal becomes obvious to the general public. It moves analysis beyond simple trend following and into the realm of anticipating market sentiment shifts. The wick is the footprint of a battle where one side lost significant ground.
The Rising Bullish Hammer: Identifying the Bottom
The rising hammer, often simply called the bullish hammer, is one of the most iconic single-candle patterns in technical analysis. It is a classic signal that appears at the bottom of a sustained downtrend, suggesting that the bearish momentum is running out of steam. Its unique shape resembles a hammer, consisting of a small body at the top of the range and a long lower wick trailing beneath it.
For a candlestick to qualify as a valid rising hammer, it must meet specific structural criteria. The lower wick should be at least two to three times the length of the candle's body. This proportion is critical because it quantifies the severity of the rejection. A short wick suggests only mild buying interest, whereas a long wick demonstrates a violent rejection of lower prices.
Analyzing the Hammer's Narrative
The narrative behind the hammer is one of initial failure followed by resurgence. The session likely opened with bears continuing the downtrend, pushing prices significantly lower. During this phase, the market sentiment is overwhelmingly negative. However, at a specific low point, the selling pressure evaporates.
Buyers recognize the asset is oversold or has hit a key support level. They aggressively enter the market, driving the price all the way back up near the opening level. If the candle closes green (above the open), it indicates that buyers not only absorbed the selling but pushed price net positive for the period. This creates a strong psychological pivot point.
Confirmation and Context
Identifying a hammer is only the first step. A common mistake is entering a trade immediately upon seeing the pattern. In cryptocurrency markets, distinct trends can persist longer than expected. Therefore, confirmation is essential. Traders typically wait for the next candle to close higher than the hammer's high to validate the reversal.
Context is equally vital. A hammer forming in the middle of a sideways range is often just noise. However, a hammer forming after a steep sell-off, specifically near a known support zone or historical low, carries significant weight. Volume analysis also plays a role here; a hammer accompanied by a spike in trading volume suggests high participation in the reversal, increasing the probability of a successful trade.
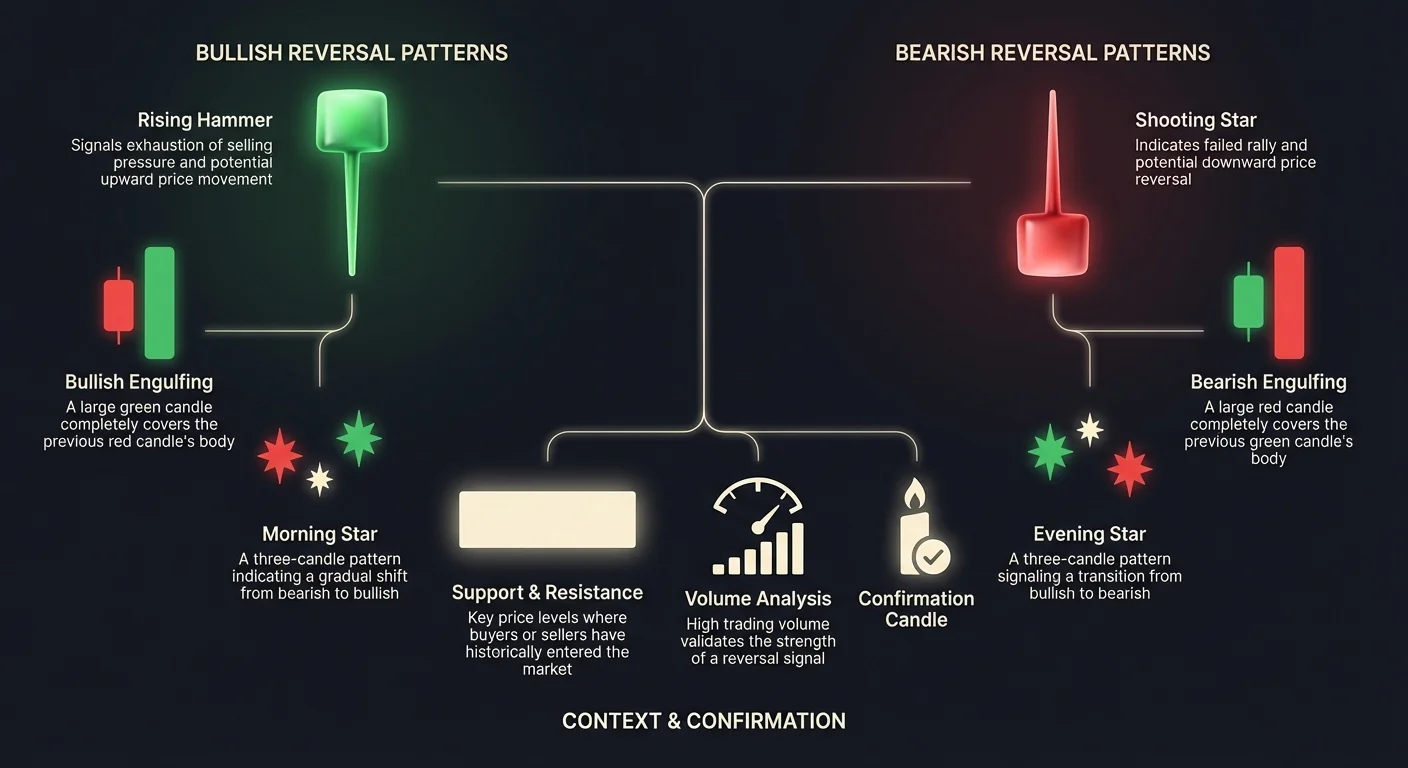
The Shooting Star: Anticipating the Peak
The bearish counterpart to the hammer is the Shooting Star, sometimes referred to as the falling hammer. This pattern appears after a strong uptrend and signals that the bullish momentum is likely fading. Visually, it looks like an inverted hammer, with a small body located near the bottom of the range and a very long upper wick extending upward.
The appearance of a Shooting Star is a warning sign for traders holding long positions. It suggests that the market's upward trajectory has hit a ceiling, at least temporarily. Just like the hammer, the validity of this pattern relies heavily on the length of the wick relative to the body. The upper shadow must be significantly longer than the real body to confirm strong rejection.
The Bearish Shift in Sentiment
The psychology behind the Shooting Star is driven by a "bull trap" scenario. During the formation of the candle, buyers push prices to new highs, continuing the established uptrend. Optimism is high, and late entrants may be buying in, expecting the rally to continue.
However, sellers utilize these higher prices to offload positions or initiate short trades. The supply overwhelms demand, forcing the price to collapse back down toward the opening level. By the time the candle closes, the bulls have lost all their intraday gains. The long upper wick remains as a monument to the failed breakout attempt, signaling that resistance is stronger than anticipated.
Trading the Shooting Star
When trading this pattern, patience is a virtue. A Shooting Star suggests a reversal, but the uptrend may still have residual strength. Conservative traders wait for the following candle to close below the body of the Shooting Star. This confirms that the bears have maintained control into the next session.
Stop-losses are usually placed just above the high of the upper wick. If price breaks that level, the pattern is invalidated, and the uptrend may resume. This pattern is particularly potent when it aligns with technical indicators like the Relative Strength Index (RSI) showing overbought conditions.
| Feature | Rising Hammer | Shooting Star |
|---|---|---|
| Trend Context | Appears after a downtrend | Appears after an uptrend |
| Visual Shape | Small body, long lower wick | Small body, long upper wick |
| Signal | Bullish Reversal (Buy) | Bearish Reversal (Sell) |
Engulfing Patterns: The Power of Momentum Shifts
While hammers and shooting stars rely on wicks to tell the story, engulfing patterns rely on the candle body to demonstrate a total shift in power. These are two-candle formations that signal a reversal based on the overwhelming strength of the second candle relative to the first.
Engulfing patterns are highly regarded because they visually display one side of the market completely overpowering the other. The defining characteristic is that the body of the second candle completely covers, or "engulfs," the body of the previous candle. This signals that the sentiment has shifted 180 degrees within a single trading period.
The Bullish Engulfing Formation
A bullish engulfing pattern appears after a downtrend. The first candle in the formation is red, consistent with the prevailing bearish trend. It reflects continued selling pressure. However, the second candle opens lower than the previous close but then rallies aggressively.
The buying pressure is so intense that the price closes higher than the previous candle's open. Visually, the green bar completely wraps around the previous red bar. This indicates that buyers have not only stopped the decline but have erased the losses of the previous period in one fell swoop.
This pattern is often triggered by a fundamental shift or a reaction to a major support level. For traders, it represents a clear entry signal, as the momentum has decisively swung in favor of the bulls. Placing a stop loss below the low of the engulfing candle provides a clear invalidation point for risk management.
The Bearish Engulfing Formation
Conversely, the bearish engulfing pattern signals the end of an uptrend. It begins with a small green candle, showing that bulls are still eking out gains. The next candle opens higher, often gapping up in traditional markets, but immediately encounters heavy selling.
The bears drive the price down aggressively, closing below the open of the previous green candle. This creates a large red body that swallows the prior bullish move. It tells traders that the buyers have been exhausted and that sellers have seized control of the market direction with conviction.
Trading this pattern involves anticipating a downward move or a deep correction. It is a common signal used to exit long positions to protect profits. When this pattern appears near a resistance level or a psychological price ceiling, the probability of a sustained reversal increases significantly.
The Morning Star: A Three-Stage Reversal
Moving beyond single and dual candle patterns, the Morning Star is a three-candle formation that provides a more detailed roadmap of a trend reversal. It is a bullish pattern that typically occurs at the bottom of a downtrend. Unlike the sudden shock of a hammer or engulfing pattern, the Morning Star reveals a gradual transition of power.
This pattern is favored by many crypto traders because it includes a specific period of market indecision. This "pause" in the trend adds credibility to the subsequent reversal, as it suggests a structural shift rather than just a momentary reaction.
Deconstructing the Three Phases
The first candle in a Morning Star is a long, bearish red candle. This confirms that the bears are still in charge and the downtrend is healthy. Selling pressure is dominant, and price closes near the lows.
The second candle is the critical pivot point. It is a small-bodied candle, often referred to as a "star" or a doji. It can be red or green, but its defining feature is its small size. This candle indicates that the selling pressure has subsided, but buyers haven't yet taken control. The market is in a state of equilibrium or hesitation.
The third candle delivers the confirmation. It is a strong bullish green candle that closes well into the body of the first red candle—ideally above the midpoint. This proves that the indecision of the second candle has resolved in favor of the buyers. The bulls have stepped in with force, launching a new upward trajectory.
Strategy and Placement
The Morning Star is a high-confidence setup when found at support levels. The middle candle represents the "bottoming out" process. Traders often place buy orders as the third candle closes or breaks higher.
Risk management is straightforward with this pattern. The stop loss is typically placed below the lowest point of the middle "star" candle. If price drops below this level, it implies the downtrend is continuing and the reversal has failed. Volume should ideally decrease on the first candle and increase significantly on the third candle, validating the influx of buying power.
The Evening Star: Confirming the Top
The Evening Star is the bearish equivalent of the Morning Star pattern. It creates a visual "top" to an uptrend and signals the start of a potential decline. Like its bullish counterpart, it unfolds over three sessions, telling a story of exhaustion and reversal.
This pattern is particularly useful in the crypto market, where parabolic runs often end with a period of distribution before a crash. The Evening Star helps traders identify this distribution phase before the heavy selling begins.
The Transition from Greed to Fear
The pattern begins with a large green candle, continuing the established uptrend. At this stage, greed is likely high, and the market looks strong. The second candle, however, signals a halt in momentum. It is a small-bodied star that gaps away from the first candle (in non-24/7 markets) or simply sits at the highs with little movement.
This small candle represents a struggle. Buyers are no longer pushing price up easily, and sellers are starting to absorb orders. The third candle confirms the reversal. It is a large red candle that closes deep into the body of the first green candle.
This third candle creates an "island" of price action at the top, leaving the buyers in the middle candle trapped in losing positions. As these trapped buyers rush to sell, the downward momentum accelerates.
Trading the Breakdown
The Evening Star is a primary signal for short sellers or for taking profits on long positions. The completion of the third candle is the trigger. Some traders wait for a breakdown below the low of the first candle for extra safety, though this may result in a worse entry price.
This pattern works best when the middle candle aligns with a major resistance level or a Fibonacci extension zone. It indicates that the market tested a high, found equilibrium, and was then rejected. This structural rejection is often more reliable than a single-candle spike because it involves time as a factor—the market spent time at the highs and decided it could not stay there.
The Role of Support and Resistance
While candlestick patterns provide the "what" and "when" of a trade, support and resistance levels provide the "where." A candlestick pattern signals a potential move, but its location on the chart determines its probability of success.
A Rising Hammer that forms in the middle of a trading range, far from any historical interaction, is largely meaningless. It may simply represent random volatility. However, that same hammer forming exactly on a trendline that has held for months is a premier buying signal.
Confluence in Trading
This concept is known as confluence. It is the overlapping of multiple independent signals to create a stronger investment thesis. When a Bullish Engulfing pattern appears at a horizontal support level, and simultaneously the RSI is indicating oversold conditions, the signal is far more powerful than any of those indicators alone.
Wicks are particularly sensitive to these levels. A long wick piercing through a resistance level but closing below it is a "fake-out." It shows that while price briefly exceeded the level, the market did not accept the new valuation. This validates the strength of the resistance.
Traders should always look left on the chart. Has this price level acted as a floor or ceiling in the past? If a Morning Star forms at a level that previously launched a rally, history is likely to repeat itself. The candlestick pattern is the trigger, but the support level is the foundation.
Risk Management and Confirmation
No technical analysis tool is infallible. Candlestick patterns are probabilities, not guarantees. The crypto market is influenced by news, macroeconomic factors, and liquidity shocks that can invalidate even the most perfect technical setup. Therefore, strict risk management is non-negotiable.
Confirmation is the first layer of defense. This usually involves waiting for the candle following the pattern to close in the desired direction. While this might mean entering a trade slightly later and sacrificing a small amount of potential profit, it drastically reduces the rate of "false positives."
Placing Stop Losses
Every trade setup based on candlesticks has a natural invalidation point. For a bullish hammer, the invalidation point is the low of the wick. If price drops below that wick, the support has failed, and the thesis is wrong. There is no reason to stay in the trade.
For engulfing patterns, the stop loss goes below the low (bullish) or above the high (bearish) of the engulfing candle. Adhering to these levels ensures that a failed pattern results in a small, manageable loss rather than a catastrophic portfolio drawdown.
Volume Analysis
Volume acts as the fuel for price movement. A reversal pattern with low volume is suspect. It suggests that there is no real conviction behind the move. Conversely, a reversal pattern accompanied by a massive surge in volume indicates that major players are entering the market.
For example, a Bearish Engulfing candle on high volume suggests that whales or institutions are offloading significant bags. This adds weight to the bearish signal. Always check the volume bars at the bottom of the chart to see if the price action is supported by trading activity.
Conclusion
Mastering the interpretation of wicks, shadows, and candlestick formations offers a significant edge in the cryptocurrency markets. These patterns are not arbitrary drawings; they are the crystallized footprints of supply and demand dynamics. From the desperate rejection of a low seen in a Rising Hammer to the failed breakout of a Shooting Star, each formation reveals the winner of a specific battle between bulls and bears.
However, the effectiveness of these signals relies heavily on the trader's discipline. Recognizing a pattern is only half the battle. The true skill lies in contextualizing that pattern within the broader market trend, confirming it with volume and support/resistance levels, and executing the trade with rigorous risk management. A Shooting Star at resistance is a trade; a Shooting Star in a vacuum is a gamble.
By combining the immediate sentiment signals of candlesticks with the structural context of the chart, traders can move away from reactive, emotional decision-making. Instead, they can adopt a proactive approach, anticipating reversals and positioning themselves alongside the dominant market forces before the trend becomes obvious to the crowd.
True trading mastery comes not from predicting the future, but from recognizing clearly what the market is telling you in the present.