
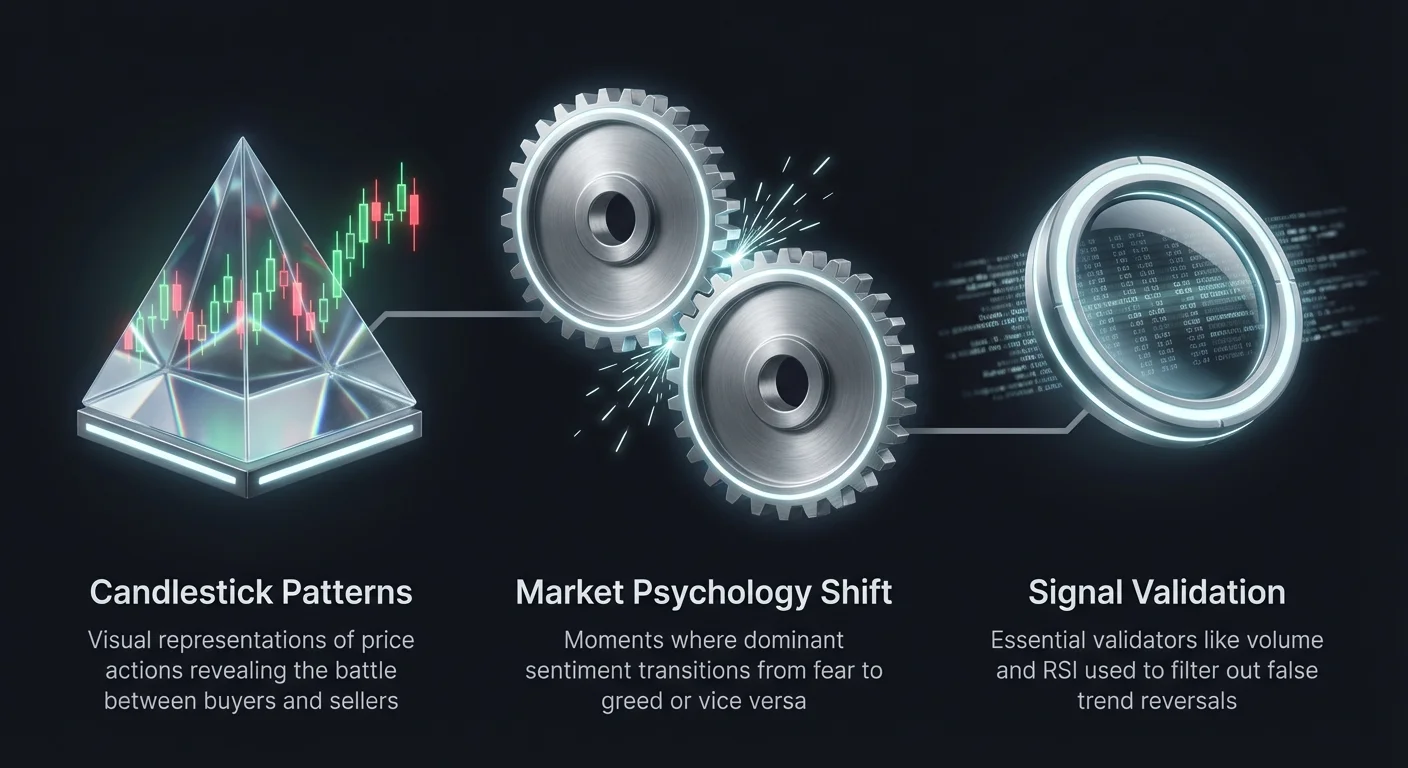
Cryptocurrency markets are defined by their volatility and rapid shifts in sentiment. Traders who can identify when a trend is about to change direction often gain a significant edge. While fundamental analysis looks at the intrinsic value of a project, technical analysis focuses on price action to predict future movements. Among the most powerful tools in a technical analyst's arsenal are candlestick patterns. These visual representations of price data tell a story about the battle between buyers and sellers.
However, relying on a single candlestick shape can be dangerous. A pattern that looks like a reversal might simply be a pause before the trend continues. To increase the probability of success, seasoned traders look for specific confirmation signals. This involves combining candlestick formations with other technical indicators. Volume spikes and momentum oscillators like the Relative Strength Index (RSI) serve as critical filters. They help distinguish between a true market reversal and a temporary fake-out.
This guide explores several high-probability candlestick patterns found in crypto trading. We will examine the mechanics of engulfing patterns, hammer formations, and star patterns. Beyond identifying the shapes, we will discuss how to validate these signals. By understanding the psychology behind the charts and applying strict confirmation criteria, traders can navigate market turns with greater confidence and precision.
The Psychology of Price Reversals
Every candlestick pattern represents a shift in market psychology. In a downtrend, sellers are dominant. They push prices lower, and fear drives capitulation. A reversal pattern signals that this dynamic is changing. Buyers are stepping in to absorb the selling pressure. This transition rarely happens instantly. It often involves a struggle where momentum slows before shifting direction.
Recognizing this struggle is key to interpreting charts. When a candle closes near its high after a long drop, it suggests that sellers have exhausted their supply. Conversely, if a rally stalls and closes near its low, buyer exhaustion is likely. These moments of exhaustion are where reversal patterns form. They mark the specific timeframe where control passes from one side of the market to the other.
Traders must also consider the context of the trend. A reversal pattern is meaningless if there is no trend to reverse. A bullish pattern must appear after a sustained price drop. A bearish pattern requires a clear uptrend to be valid. Attempting to trade these shapes in a sideways or choppy market often leads to false signals and losses. Context determines the reliability of the setup.
Mastering the Bullish Engulfing Pattern
The bullish engulfing pattern is a potent two-candle formation that signals a potential end to a downtrend. It provides a strong visual cue that buyer sentiment is overwhelming seller conviction. This pattern is particularly popular in crypto markets due to its clarity. It typically forms near support levels or after a sharp decline in asset value.
Identifying the Formation
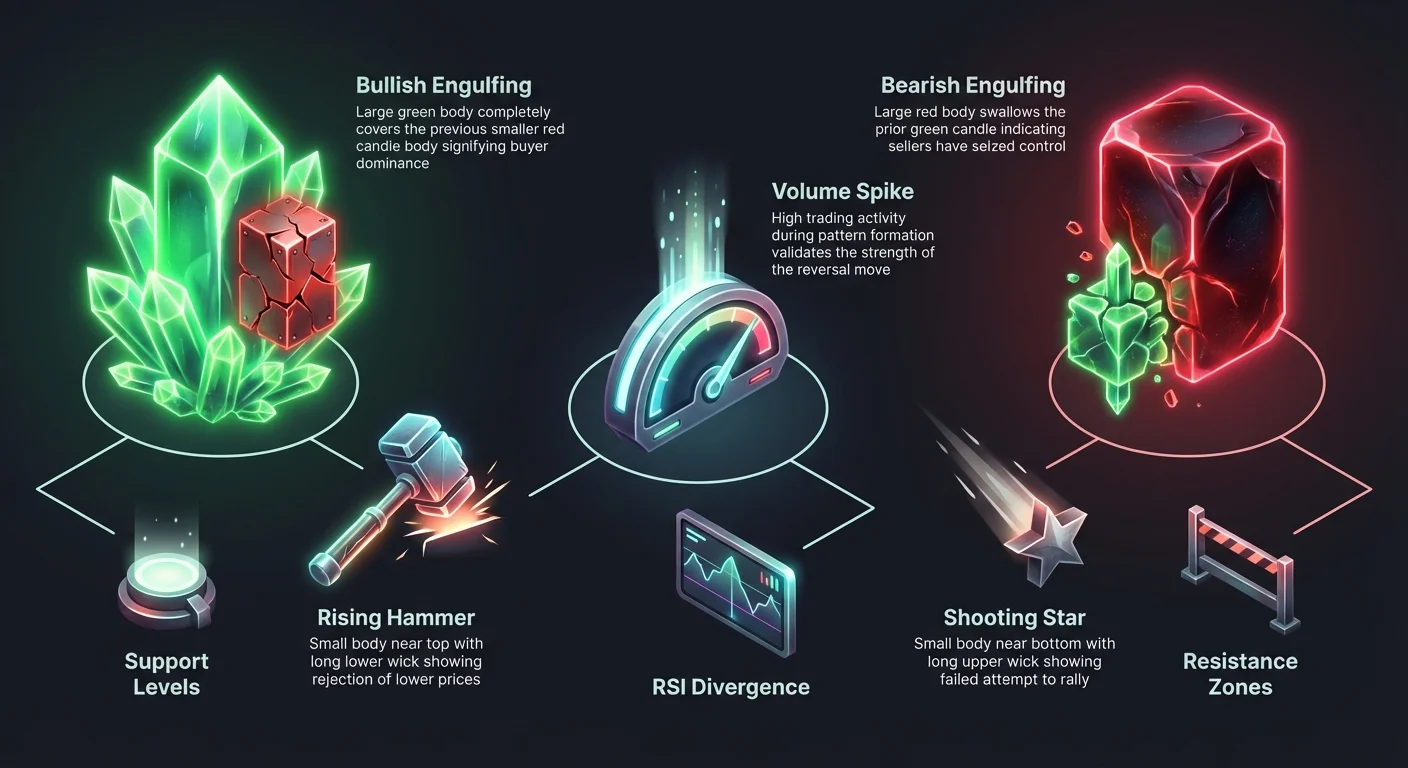
The structure of a bullish engulfing pattern is distinct. The first candle is bearish, or red, consistent with the prevailing downtrend. It reflects continued selling pressure. The second candle is the game-changer. It is a large bullish, or green, candle. The key characteristic is that the body of the green candle completely covers, or "engulfs," the body of the previous red candle.
In traditional markets, the green candle must open below the red candle's close. However, crypto markets trade continuously without daily breaks. Therefore, gaps are rare. In crypto trading, the primary requirement is that the green body is larger than the red body and wraps around it. The visual impact should be one of total dominance by the second candle.
Interpreting the Signal
The psychology here is a sudden surge in buying power. Sellers pushed the price down during the first period. In the second period, price may have dipped initially, but buyers aggressively bid the asset up. They drove the price well past the opening level of the previous session. This indicates that the downward momentum has been negated. This indicates that the downward momentum has been negated.
Traders view this as a signal to enter a long position. The reliability of the pattern increases if the second candle closes near its high, leaving little to no upper wick. This shows that buyers held control right until the candle closed. Placing a stop-loss below the low of the engulfing pattern is a common risk management technique used with this setup.
Decoding the Bearish Engulfing Signal
The bearish engulfing pattern is the mirror image of its bullish counterpart. It serves as a warning sign at the top of an uptrend. When this pattern appears, it suggests that the bulls are losing their grip and sellers are seizing control. It is frequently used to identify market tops or exit points for long positions.
Anatomy of the Drop
To spot a bearish engulfing pattern, look for a two-candle sequence following a price rally. The first candle is a smaller green candle, indicating the uptrend is still active but perhaps losing steam. The second candle is a large red candle. This bearish candle opens above or near the previous close and crashes down to close below the previous open.
The body of the red candle must completely engulf the body of the green candle. This visual "swallowing" of the previous price action signifies a violent shift in sentiment. The larger the red candle relative to the green one, the stronger the signal. A massive red candle implies a rush of sell orders that completely overwhelmed the available buyers.
Trading Implications
When a bearish engulfing pattern forms near a known resistance level, it carries significant weight. It tells traders that the market rejected the higher prices. Those who bought late in the trend are now trapped in losing positions. As they panic and sell, the downward momentum accelerates.
Traders often use this signal to initiate short positions. The standard approach involves entering the trade after the engulfing candle closes. Confirmation from the next candle—such as a continued drop in price—can add an extra layer of security. A stop-loss is typically placed just above the highest point of the engulfing formation to protect against a false reversal.
Single-Candle Rejections: Hammers and Shooting Stars
Not all reversals require two candles. Some of the most reliable signals come from single candlesticks that show sharp intraday rejections. The Rising Hammer and the Shooting Star are classic examples of this phenomenon. They reveal a failed attempt to push the price further in the direction of the trend.
The Rising Bullish Hammer
The Rising Hammer appears after a downtrend. It features a small real body located near the top of the candle range and a long lower wick. The lower wick should be at least two to three times the length of the body. The color of the body can be green or red, though green is more bullish.
This shape tells a story of resilience. During the session, sellers pushed the price down significantly, creating the long lower wick. However, they could not sustain the pressure. Buyers stepped in and drove the price back up to close near the opening level. This failure to hold the lows indicates that the bearish trend is weakening.
The Shooting Star
The Shooting Star is the bearish equivalent of the hammer. It forms after a strong uptrend. The candle has a small real body near the bottom of the range and a long upper wick. Like the hammer, the wick should be significantly longer than the body. This pattern signals that buyers attempted to push the price to new highs but were forcefully rejected.
Market psychology during a Shooting Star involves a "bull trap." Late buyers rush in due to fear of missing out (FOMO). Sellers take advantage of this liquidity to unload positions, driving the price back down. By the close, the bulls have lost all their intraday gains. This rejection often triggers profit-taking and the start of a correction.
| Feature | Rising Hammer | Shooting Star |
|---|---|---|
| Trend Context | Downtrend | Uptrend |
| Wick Position | Long Lower Wick | Long Upper Wick |
| Signal Type | Bullish Reversal | Bearish Reversal |
Three-Candle Reversals: Morning and Evening Stars
For traders who prefer more confirmation than a single candle can provide, three-candle patterns offer a robust alternative. The Morning Star and Evening Star patterns unfold over three sessions. They represent a complete cycle of momentum: trend, indecision, and reversal.
The Morning Star
The Morning Star signals a bullish reversal at the bottom of a downtrend. The first candle is a large red candle, confirming that bears are still in charge. The second candle is the key. It is a small-bodied candle, sometimes a doji, that indicates indecision. The downward momentum has stalled.
The third candle is a strong green candle that closes well into the body of the first red candle. This confirms that the indecision has resolved in favor of the bulls. The visual pattern resembles a "U" shape. It shows a clear transition from selling to stalling, and finally to buying.
The Evening Star
The Evening Star appears at the top of an uptrend. It starts with a large green candle, showing healthy bullish momentum. The second candle is small, signaling that buyers are losing energy. The third candle is a large red candle that penetrates deep into the body of the first green candle.
This formation creates an inverted "U" shape. It warns that the uptrend has hit a wall and sellers are taking over. The pattern is considered highly reliable when it forms at resistance zones. The middle "star" candle represents the exact moment where the distribution of assets shifts from confident bulls to aggressive bears.
The Role of Volume in Confirmation
Identifying the shape of a candlestick pattern is only the first step. To validate the signal, traders must analyze trading volume. Volume represents the fuel behind a price move. A reversal pattern that forms on low volume is suspect. It suggests a lack of conviction from market participants. Conversely, a pattern accompanied by a spike in volume indicates strong participation.
When analyzing a Bullish Engulfing or Rising Hammer, traders want to see high volume on the reversal candle. This confirms that big players are entering the market and absorbing the sell orders. If the price reverses but volume remains low, the move might be a "dead cat bounce" rather than a true bottom. Low volume implies that the sellers simply took a break, not that buyers have taken control.
For bearish patterns like the Shooting Star or Bearish Engulfing, volume is equally important. A spike in volume during the rejection wick of a Shooting Star shows heavy selling pressure at the highs. It confirms that supply vastly exceeded demand at that price level. If the subsequent downward move also sees expanding volume, it validates the strength of the new bearish trend.
Integrating RSI and Structural Confluence
Technical indicators like the Relative Strength Index (RSI) provide crucial context for candlestick patterns. The RSI measures the speed and change of price movements to identify overbought or oversold conditions. A candlestick pattern is far more powerful when it aligns with extreme RSI readings.
RSI Divergence and Extremes
When a Bullish Engulfing or Morning Star pattern forms, traders should check the RSI. If the RSI is below 30, the market is considered oversold. A reversal signal in this zone carries a higher probability of success. Even more powerful is bullish divergence. This occurs when the price makes a lower low, but the RSI makes a higher low. If a candlestick pattern forms during this divergence, it is a prime setup.
Conversely, for bearish patterns like the Evening Star, traders look for an RSI above 70. This indicates overbought conditions. If the price hits a new high while the RSI fails to do so (bearish divergence), the trend is exhausted. A Shooting Star appearing at this moment serves as the trigger for the reversal.
Structural Support and Resistance
Candlestick patterns should never be traded in a vacuum. Their location on the chart is paramount. A Rising Hammer is significant if it touches a long-term support line or a moving average. If it appears in the middle of a trading range, it is essentially noise.
Similarly, a Bearish Engulfing pattern is most effective when it forms at a known resistance level or a Fibonacci retracement line. Confluence occurs when multiple signals align at the same price point. For example, a Shooting Star at resistance with bearish RSI divergence and a volume spike is a high-confidence trade setup.
Limitations and Risk Management
Despite their utility, candlestick patterns are not crystal balls. They fail regularly, especially in choppy or low-volume markets. A "fake-out" occurs when a pattern forms, triggers an entry, and then immediately fails. For instance, a Bullish Engulfing might lead to a brief pop in price before the downtrend resumes with force.
This reality makes risk management non-negotiable. Every trade setup based on these patterns requires a predefined stop-loss. For bullish patterns, the stop-loss is typically placed just below the lowest point of the formation. For bearish patterns, it goes just above the highest point. This ensures that if the market invalidates the signal, the loss is contained.
Traders must also exercise patience. It is often wise to wait for the candle to close before entering. A candle that looks like a Hammer with 10 minutes left in the session can easily morph into a solid red candle by the close. Acting prematurely leads to unnecessary losses. Waiting for the next candle to confirm the move—such as a green close following a hammer—further reduces risk, though it may result in a slightly worse entry price.
Strategic Implementation in Crypto
Crypto markets operate 24/7, which creates unique nuances for candlestick analysis. Since there is no market close and open in the traditional sense, true gaps between candles are rare. This affects strict definitions, such as the "gap down" often required for a traditional Morning Star. Crypto traders focus more on the relative shape and displacement of the candles rather than precise gap mechanics.
Volatility in crypto also means that wicks tend to be longer. A "textbook" pattern might look slightly messier on a Bitcoin or Ethereum chart compared to a stock chart. Traders often need to allow for slightly more variance. The core psychology, however, remains identical. Fear and greed drive price action in all markets.
Timeframes matter significantly. Patterns found on the 1-minute or 5-minute charts are prone to high failure rates due to market noise. Patterns on the 4-hour, daily, and weekly charts carry much more weight. They represent a more sustained battle for control and are generally more reliable for predicting trend changes.
Conclusion
Candlestick patterns like the Engulfing, Hammer, and Star formations offer a window into the emotional state of the market. They translate complex buying and selling pressure into recognizable visual signals. Whether it is the decisive takeover of an Engulfing candle or the sharp rejection of a Shooting Star, these patterns help traders anticipate when the tide is turning.
However, the true power of these signals lies in confirmation. Trading a shape in isolation is a gamble. Combining these patterns with volume analysis, RSI divergence, and key support or resistance levels transforms them into a robust trading strategy. This multi-layered approach filters out noise and highlights the opportunities with the best risk-reward ratios.
By respecting the limitations of technical analysis and enforcing strict risk management, traders can effectively use these tools. No pattern guarantees a profit, but consistent application of these principles creates a structured framework for navigating the chaos of the crypto markets.
Wait for the candle to close and confirm the signal with volume or indicators before entering a trade.