
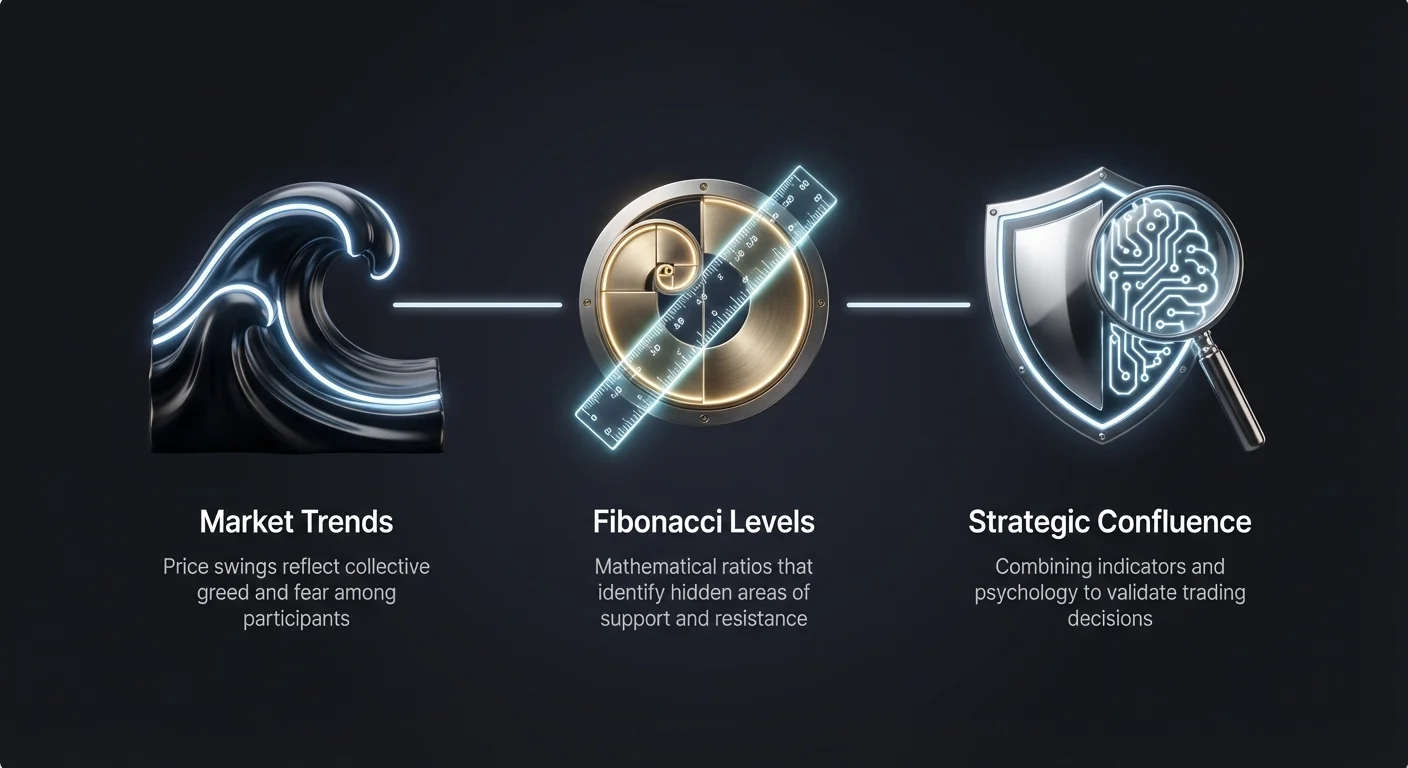
Successful trading in the cryptocurrency market requires more than just intuition or following the latest news headlines. It demands a structured approach to understanding price movements, market psychology, and potential turning points. Technical analysis serves as the backbone for many traders, offering tools to interpret historical data and project future possibilities. Among the most popular and mathematically intriguing of these tools are Fibonacci retracements and extensions. These tools help traders identify hidden levels of support and resistance that are not immediately visible on a standard price chart.
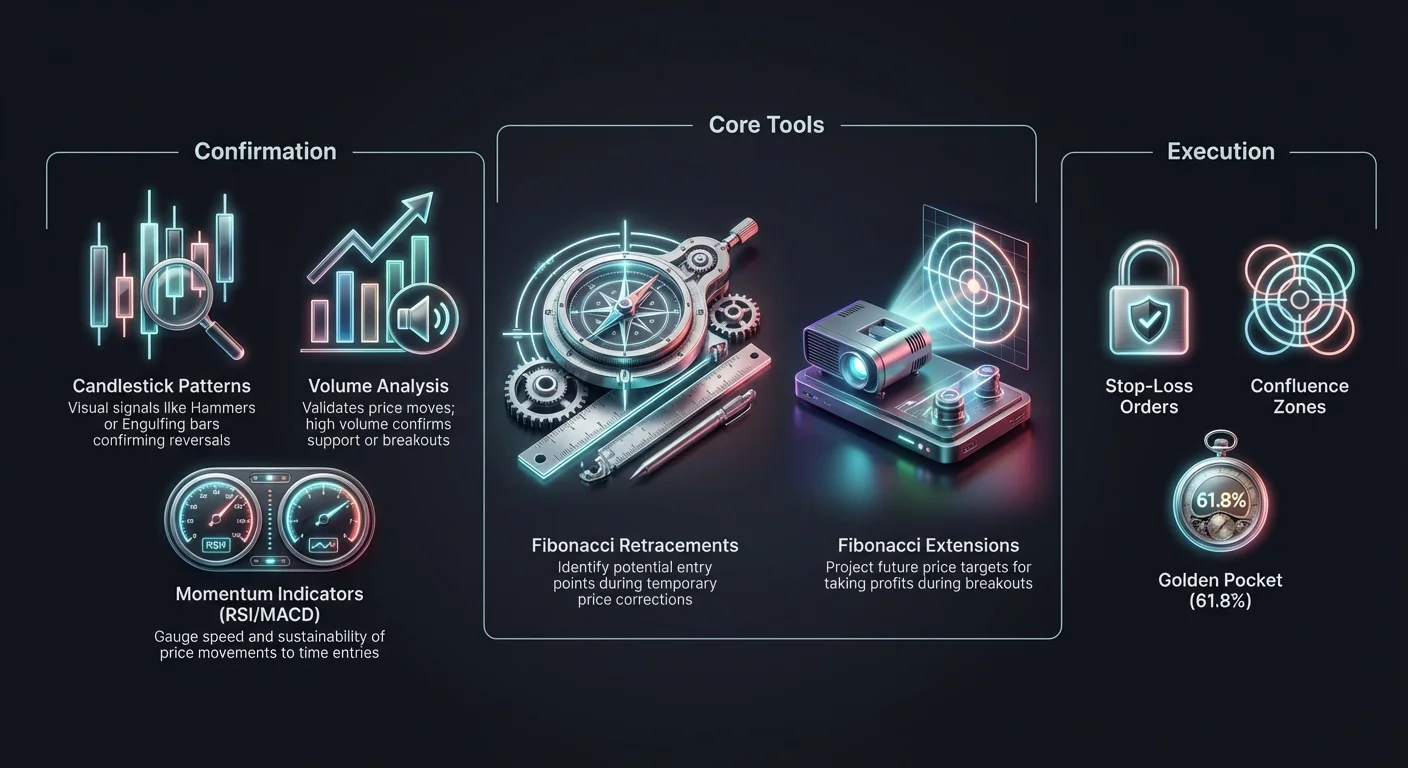
By applying Fibonacci ratios to price swings, analysts can pinpoint areas where a correction might end or where a breakout rally might exhaust itself. However, relying on a single tool is rarely a path to consistent profitability. The true power of Fibonacci levels emerges when they are combined with other technical indicators found in a comprehensive trading strategy. By integrating concepts such as candlestick patterns, volume analysis, and momentum oscillators, traders can validate their findings and make decisions with higher conviction.
This guide explores the mechanics of Fibonacci retracements and extensions within the context of the broader crypto ecosystem. We will examine how these mathematical ratios interact with market sentiment and technical indicators. From identifying the "golden pocket" to setting realistic profit targets during a discovery phase, we will cover the essential techniques for pinpointing price targets and reversal zones.
The Intersection of Math and Market Psychology
Market movements are rarely linear. Prices ebb and flow, creating waves that reflect the collective emotions of greed and fear among participants. Technical analysis attempts to measure these waves to predict future behavior. The application of Fibonacci sequences to trading is based on the observation that markets tend to retrace a predictable portion of a move before continuing in the original direction. These retracement levels act as psychological barriers where traders often place buy or sell orders.
Gauging Investor Sentiment
Sentimental analysis is a crucial component of understanding why specific price levels matter. It involves evaluating investor emotions and the overall mood of the market. When a cryptocurrency is in a strong uptrend, optimism drives prices higher. However, even the strongest bull markets experience pauses where early entrants take profits and new buyers wait for a better entry price.
During these pauses, fear and greed battle for control. Fibonacci levels provide a framework for this psychological warfare. A retracement to a key Fibonacci level often coincides with a shift in sentiment. If the level holds, confidence returns, and the uptrend resumes. If it breaks, fear may take over, leading to a deeper correction. Understanding this psychological backdrop helps traders interpret price action at these critical zones.
The Nature of Volatility and Trends
Volatility is a defining characteristic of cryptocurrency markets. It refers to the speed and extent of price changes over a specific period. High volatility presents both risks and opportunities. In a highly volatile market, price swings are larger, making Fibonacci levels even more relevant as targets for these wide expansions and deep corrections.
Trends act as the prevailing wind for price direction. A trend can be upward, downward, or sideways. Identifying the trend is the first step in any technical analysis. Fibonacci retracements are primarily trend-following tools. They are designed to identify entry points within an existing trend, allowing traders to join the movement at a favorable price. Extensions, on the other hand, help anticipate where the volatility might stretch the price during a breakout.
Deciphering Fibonacci Retracement Levels
A Fibonacci retracement is drawn by connecting a significant low point to a significant high point on a chart. This creates a series of horizontal lines that act as potential support levels during a pullback. The most common ratios used are 23.6%, 38.2%, 50%, and 61.8%. While 50% is not technically a Fibonacci ratio, it is included because of its psychological importance as the midpoint of a price swing.
The 61.8% level is often referred to as the "golden ratio" or "golden pocket." In crypto trading, this area is closely watched. When a price corrects to this level, it often attracts significant buying interest from traders who missed the initial move. This deep retracement offers a high reward-to-risk ratio for those looking to enter long positions.
Conversely, in a downtrend, the tool is drawn from a high to a low. The levels then act as resistance, marking areas where a relief rally might fail. Traders looking to short the market watch these zones for signs of weakness. The 38.2% level indicates a strong trend where buyers (in an uptrend) step in aggressively, while a drop to 78.6% suggests the trend is weakening and may be at risk of a full reversal.
Confirming Reversals with Candlestick Patterns
Identifying a Fibonacci level is only the first step. Traders must wait for price action to confirm that the level is holding. Candlestick charts are the preferred method for visualizing this interaction. Unlike line charts that only show closing prices, candlesticks provide detailed information about the open, high, low, and close of a specific timeframe. This detail is vital for spotting reversal signals.
Bullish Reversal Signals
When price approaches a Fibonacci support level during an uptrend, traders look for specific candlestick formations that indicate buyer interest. One such pattern is the "Hammer." This candle has a small body and a long lower wick. The long wick demonstrates that sellers pushed the price down, but buyers rallied to close the session near the open. A Hammer forming exactly on the 61.8% retracement level is a strong signal that the correction may be over.
Another powerful formation is the "Bullish Engulfing" pattern. This occurs when a large green candle completely consumes the body of the previous red candle. If this happens at a key Fibonacci support zone, it suggests a shift in momentum from bearish to bullish. Traders often use these patterns as a trigger to enter a trade, placing stop-loss orders below the wick of the reversal candle to manage risk.
Bearish Reversal Signals
In a downtrend, or when looking to take profits at a Fibonacci extension, bearish patterns become the focus. The "Shooting Star" is the inverse of the Hammer. It features a small body with a long upper wick, indicating that buyers attempted to push the price higher but failed. If a Shooting Star appears at a resistance level, it signals that the upward momentum is exhausted.
The "Bearish Engulfing" pattern serves a similar function. A large red candle engulfing a previous green candle at a resistance level indicates that sellers have taken control. Recognizing these patterns allows traders to react to market behavior in real-time, rather than simply hoping a mathematical level will hold. This combination of static levels and dynamic price action is a cornerstone of effective technical analysis.
The Role of Volume in Validating Levels
Trading volume is the fuel that drives market moves. It represents the total amount of an asset traded during a specific period. Analyzing volume alongside Fibonacci levels provides crucial context about the strength or weakness of a price move. A level that is tested on low volume is less significant than one tested on high volume.
Volume Spikes at Support
When price retraces to a Fibonacci support level, traders want to see a reaction in the volume profile. A decline in volume as the price drops into the support zone suggests that selling pressure is drying up. This "drying up" indicates that the bears are losing their grip.
However, for a reversal to be confirmed, high volume is needed on the subsequent bounce. If the price touches the 61.8% level and immediately shoots up with a massive spike in buy volume, it confirms that institutional or large-scale interest is present at that price. This high-volume rejection of lower prices acts as a green light for many trend followers.
Breakouts and Extensions
Volume is equally important when using Fibonacci extensions to find targets. An extension level is a projected price point above the previous high (in an uptrend). When price breaks out of a previous range and heads toward these targets, volume should increase. Rising volume confirms the breakout and suggests the trend has enough momentum to reach the extension levels, such as 1.618 or 2.618.
If price approaches a Fibonacci extension target but volume is decreasing, it creates a "divergence." This lack of participation suggests the trend is running on fumes. Smart traders interpret this as a warning sign to tighten stop-losses or begin taking profits, as the likelihood of a reversal increases when the market advances on weak volume.
Integrating Moving Averages
Moving averages (MAs) smooth out price data to identify the underlying trend. They act as dynamic support and resistance lines that move with the price, as opposed to the static lines provided by Fibonacci retracements. The synergy between these two tools creates powerful "confluence" zones.
The Power of Confluence
Confluence occurs when two different technical indicators identify the same price level as significant. For example, if the 50-day moving average aligns perfectly with the 50% Fibonacci retracement level, that price point becomes a dual support zone. The probability of a bounce from this level is statistically higher because it is being watched by both Fibonacci traders and moving average traders.
In a strong uptrend, price often rides above the 50-day MA. A pullback that touches this moving average while simultaneously hitting a Fibonacci ratio offers a high-confidence entry setup. Traders essentially get double confirmation that the area is valid support.
Golden Cross Confirmation
The "Golden Cross" is a classic bullish signal that occurs when a short-term moving average (like the 50-day) crosses above a long-term moving average (like the 200-day). This event signals that long-term momentum is shifting to the upside.
Traders can use the Golden Cross to determine the bias of their Fibonacci analysis. If a Golden Cross has recently occurred, traders should prioritize looking for long entries at Fibonacci support levels. Conversely, if a "Death Cross" (50-day crossing below 200-day) has occurred, the bias shifts to the downside. In this scenario, traders would use Fibonacci retracements to identify resistance levels to sell into, rather than support levels to buy.
Momentum Indicators: RSI and MACD
While price and volume tell us what is happening, momentum indicators tell us how fast it is happening and whether the move is sustainable. Oscillators like the Relative Strength Index (RSI) and the Moving Average Convergence Divergence (MACD) are excellent tools for confirming Fibonacci entries.
RSI Oversold and Overbought Conditions
The RSI measures the speed and change of price movements, oscillating between 0 and 100. Traditionally, a reading above 70 is considered overbought, while a reading below 30 is considered oversold. These readings are particularly useful when price hits a Fibonacci level.
If price drops to a key Fibonacci support level and the RSI simultaneously dips below 30, it creates a strong buy signal. The market is mathematically at support and technically oversold. This alignment suggests the sellers are exhausted. Conversely, if price hits a Fibonacci extension target and RSI is above 70, it warns that the asset is overextended, signaling a prime area to lock in gains.
MACD Signal Crossovers
The MACD is a trend-following momentum indicator that shows the relationship between two moving averages of a price. It consists of a MACD line, a signal line, and a histogram. Traders watch for crossovers between the MACD line and the signal line as buy or sell triggers.
When analyzing a Fibonacci retracement, a trader might wait for the price to hit the support level and then look for a bullish crossover on the MACD. This crossover confirms that momentum has shifted back in favor of the buyers. Relying on the MACD helps filter out false bottoms, as the indicator requires a shift in price momentum before generating a signal. This patience can prevent traders from entering a position too early while the knife is still falling.
Fibonacci Extensions and Profit Targets
While retracements help traders find entry points, extensions help them decide where to exit. One of the most difficult aspects of trading crypto is knowing when to sell, especially when an asset enters "price discovery." Price discovery happens when a coin breaks its all-time high and there is no historical resistance to guide traders.
The 1.618 Extension
The 1.618 Fibonacci extension is one of the most widely respected targets in technical analysis. To find this level, a trader draws the tool from the swing low to the swing high of the previous move. The tool then projects levels above the high. The 1.618 level is often the primary target for a breakout rally.
Psychologically, this level represents a standard expansion of the previous trend. Many automated trading algorithms and institutional traders have sell orders parked at this level. Consequently, price often pauses or reverses upon hitting it. For traders holding a position from a lower entry, selling a portion of their holdings at the 1.618 extension is a prudent strategy to secure profits.
Advanced Extension Levels
If the trend is exceptionally strong, supported by high volume and fundamental catalysts, price may blow past the 1.618 level. In such cases, the next major targets are 2.618, 3.618, and 4.236. These higher extensions are common in the volatile "parabolic" phases of a crypto bull market.
However, relying solely on these mathematical projections carries risk. Traders should always look for other signs of exhaustion, such as bearish candlestick patterns or bearish divergence on the RSI, before exiting completely. Extensions provide a roadmap, but market conditions dictate the speed and distance of the journey.
Stochastic Oscillator as a Timing Tool
The Stochastic Oscillator is another momentum indicator that compares a specific closing price of an asset to a range of its prices over a certain period. Like the RSI, it is used to identify overbought and oversold conditions, but it is often more sensitive and faster-moving. This makes it an excellent tool for fine-tuning entries at Fibonacci levels.
Spotting Bullish Divergence
A powerful signal occurs when the price makes a lower low into a Fibonacci support zone, but the Stochastic Oscillator makes a higher low. This is known as bullish divergence. It indicates that while the price is dropping, the downward momentum is actually weakening.
When this divergence appears at a "golden pocket" retracement level (61.8%), it provides a high-probability setup. The indicator reveals that the selling pressure is superficial and a reversal is imminent. Traders can use the crossover of the Stochastic lines (when the %K line crosses above the %D line) as the precise trigger to pull the trigger on a trade.
Avoiding False Signals
Because the Stochastic Oscillator is sensitive, it can produce false signals during strong trends. In a massive pump, the indicator can stay "overbought" (above 80) for a long time while price continues to rocket higher. Therefore, selling purely because the Stochastic is overbought is dangerous.
The tool is best used in consolidating or ranging markets, or specifically to time entries on pullbacks. When the market is trending strongly, it is safer to use the Stochastic only for joining the trend on dips (oversold readings) rather than betting against the trend on peaks.
Fundamental Context and Liquidity
Technical analysis does not exist in a vacuum. Fundamental analysis, which evaluates an asset's intrinsic value and adoption, provides the "why" behind the "what" of the chart. A Fibonacci setup is far more likely to succeed if it aligns with positive fundamental developments, such as a protocol upgrade or increased institutional adoption.
Liquidity Considerations
Liquidity refers to how easily an asset can be bought or sold without affecting its price. High liquidity is essential for technical levels to work effectively. In low-liquidity markets (like micro-cap altcoins), price manipulation is easier, and technical levels like Fibonacci retracements may be ignored or overrun by a single large order.
Major cryptocurrencies like Bitcoin and Ethereum have deep liquidity, making their chart patterns more reliable. When trading these assets, Fibonacci levels often act as self-fulfilling prophecies because thousands of traders and algorithms are watching the exact same price points. Understanding the liquidity profile of the asset you are trading is critical for determining how much weight to give your technical analysis.
Risk Management and Position Sizing
No matter how perfect a Fibonacci setup looks, the market deals in probabilities, not certainties. Risk management is the safety net that protects a trader's capital when the analysis fails. Using stop-loss orders is non-negotiable for professional traders.
Placing Stop-Losses
When buying at a Fibonacci support level, a logical place for a stop-loss is just below the next Fibonacci level. For example, if entering at the 50% retracement, a stop-loss might be placed below the 61.8% level. If the price breaks below the 61.8% level, the bullish thesis is invalidated, and it is better to exit with a small loss than to hold a losing bag.
Position sizing determines how much capital to allocate to a single trade. It should be based on the distance to the stop-loss. If the stop-loss is wide (far from the entry price), the position size should be smaller to keep the total risk constant. This disciplined approach ensures that no single bad trade can severely damage the portfolio.
Psychological Discipline
Trading psychology plays a massive role in executing these strategies. Fear of missing out (FOMO) often causes traders to chase prices rather than waiting for a retracement to a Fibonacci level. Conversely, fear of loss can cause a trader to hesitate when the price finally hits their buy zone.
Sticking to a plan requires emotional discipline. Fibonacci levels provide an objective framework that helps remove emotion from the decision-making process. By deciding in advance where to enter and where to exit, traders can avoid impulsive decisions driven by market noise and short-term volatility.
Combining Strategies for Maximum Effectiveness
The most successful traders do not use Fibonacci levels in isolation. they build a "case" for a trade by stacking multiple layers of evidence. This holistic approach is often called "confluence trading."
| Indicator | Condition for Long Entry | Condition for Short Entry |
|---|---|---|
| Fibonacci | Price at 61.8% or 50% Retracement | Price at Extension or Resistance |
| Candlestick | Hammer or Bullish Engulfing | Shooting Star or Bearish Engulfing |
| Volume | Low volume on drop, Spike on bounce | Low volume on rise, Spike on drop |
| RSI | Oversold (<30) or Bullish Divergence | Overbought (>70) or Bearish Divergence |
| MACD | Bullish Crossover | Bearish Crossover |
By requiring at least three of these factors to align before taking a trade, a trader filters out low-quality setups. For instance, a touch of the 61.8% line might be ignored if volume is low and the RSI is still pointing down. But if the 61.8% line coincides with a 200-day moving average, an RSI divergence, and a Hammer candle, the conviction for the trade increases exponentially.
This method turns trading into a game of patience. Instead of constantly clicking buttons, the trader acts like a sniper, waiting for the price to come to their predefined zone where the odds are heavily stacked in their favor.
Conclusion
Fibonacci retracements and extensions offer a window into the hidden architecture of market trends. By quantifying the natural ebb and flow of price action, these tools allow traders to anticipate reversal zones and set profit targets with a degree of precision that guesswork cannot match. From the "golden pocket" entries to the 1.618 extension exits, the mathematical ratios provide a structured map for navigating the chaotic landscape of cryptocurrency volatility.
However, the true strength of Fibonacci analysis lies in its integration with other market signals. Confirming mathematical levels with candlestick patterns, volume spikes, moving averages, and momentum oscillators transforms simple lines on a chart into robust trading setups. This confluence of data points helps filter out noise and highlights the opportunities where probability is on the side of the trader.
Ultimately, successful trading is a balance of technical skill and disciplined risk management. No indicator works 100% of the time, and every trade carries risk. By combining Fibonacci strategies with sound money management principles and emotional control, traders can navigate the markets with confidence, turning volatility from a threat into an opportunity for growth.
Consistency comes from waiting for the perfect alignment of price, pattern, and momentum before executing your plan.