
The automation of crypto trading has revolutionized how retail and professional investors approach the volatile digital asset market. Among the most popular tools available is the Grid Trading Bot, a strategy designed to capitalize on sideways price action and internal market volatility.
A grid bot operates on a simple premise: systematically buying an asset when its price falls and selling it when the price rises, generating small, frequent profits within a predefined range. While this concept sounds easy, the true challenge lies in optimization. Deploying a bot with arbitrary settings is often a recipe for disaster. Successful algorithmic trading requires rigorous, data-driven methodology, ensuring that the bot’s parameters are perfectly tuned to the specific market conditions it will operate in.
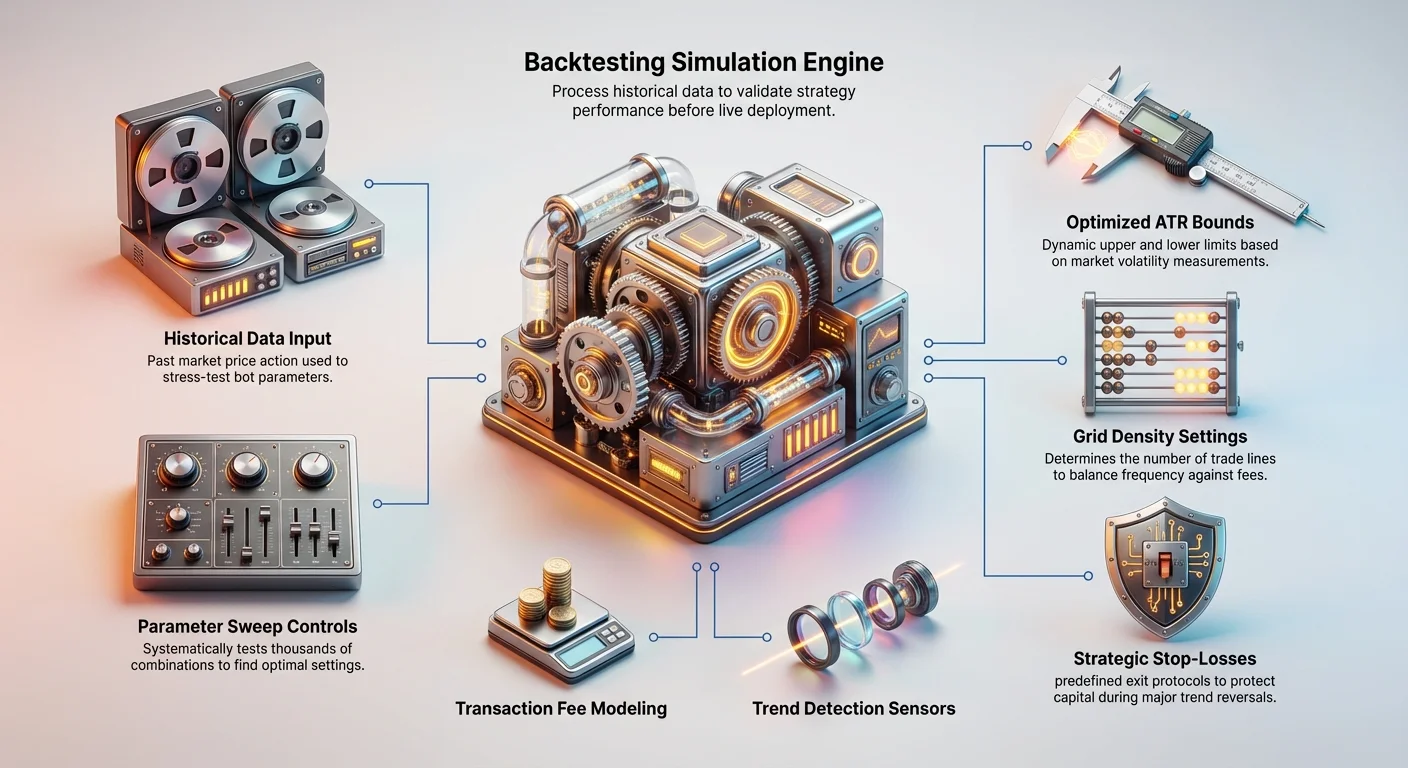
This guide moves beyond the basic setup, delving into the advanced techniques necessary to optimize your grid trading bot’s performance. We will focus specifically on backtesting methodologies—using historical data to validate and refine the most critical parameters: the boundaries, density, risk controls, and the crucial ability to distinguish between a profitable range-bound market and a dangerous trending market.

The Core Mechanics of Grid Trading
Before optimizing, it is essential to solidify your understanding of how a grid bot functions and, crucially, where it excels and where it fails. Grid trading is fundamentally a mean reversion strategy. It assumes that if a price deviates from a central point, it will eventually revert back toward that mean.
How Grid Bots Generate Profit
Imagine a price range for a crypto asset, say between $1,800 and $2,200. A grid bot divides this range into "rungs on a ladder."
- Setting the Grid: If you set 10 grids, the price distance between each rung is $40 ($400 range / 10 grids).
- The Buy/Sell Logic: The bot places a sequence of limit orders. When the price falls to a lower rung, a buy order executes. Immediately, a corresponding sell order is placed one rung higher. When the price rises and hits that higher rung, the sell executes, generating a tiny profit (the difference between the buy and sell price, minus fees).
- Continuous Cycle: This process repeats indefinitely as long as the price stays within the defined high and low boundaries, accumulating small, consistent profits from minor market fluctuations.
The Grid Bot’s Natural Habitat
Grid bots thrive in ranging or consolidating markets—periods where the price moves back and forth without a strong directional trend. These are the periods of high internal volatility (choppiness).
However, grid bots are highly susceptible to major market shifts:
- Failure in Strong Uptrends: If the price breaks the upper boundary, the bot stops executing buy orders. It sits on the remaining assets it purchased at lower prices (which is profitable, but the automated trading stops).
- Failure in Strong Downtrends (The Primary Risk): If the price crashes through the lower boundary, the bot has sequentially bought the asset all the way down. It is now holding a large bag of cryptocurrency that is rapidly losing value, leading to potentially massive unrealized losses.
Optimization is the process of defining the boundaries, density, and stop-loss mechanisms to maximize profit in the happy middle while minimizing exposure to the dangerous extremes.
Understanding Backtesting: The Key to Optimization
Backtesting is the practice of applying a trading strategy to historical data to see how it would have performed. For grid trading, backtesting moves beyond merely confirming profitability; it is a necessity for validating parameter robustness.
Choosing Relevant Historical Data
The results of a backtest are only as good as the data you feed it. A common beginner mistake is testing a bot on a single, highly favorable market period (e.g., a perfect sideways month) and assuming those settings will work forever.
Best Practices for Data Selection:
- Look for Structural Similarity: If you intend to run the grid bot during a market consolidation phase, test the parameters exclusively on past consolidation phases. Avoid testing a ranging bot during a parabolic bull run or a sudden crash.
- Include Fee Simulation: The most crucial element in grid bot backtesting is incorporating trading fees and slippage. Since grid bots generate dozens or hundreds of trades daily, small fees (even 0.1%) can significantly reduce or eliminate profit. A reliable backtest must accurately model these costs.
- Test Stress Periods: Introduce periods of high unexpected volatility within the testing sample (e.g., a sudden 5% drop followed by a sharp recovery) to see if the proposed bounds and stop-loss mechanisms hold up, or if they trigger massive unnecessary losses or premature exits.
Defining Success Metrics Beyond P&L
While profit and loss (P&L) is important, sophisticated traders use multiple metrics to judge a strategy’s robustness:
| Metric | Definition | Why it Matters for Grid Bots |
|---|---|---|
| Maximum Drawdown | The largest peak-to-trough decline during a specific period. | This quantifies the highest potential temporary loss. Grid bots naturally have higher drawdowns because they buy on the way down. Keeping this number manageable is critical. |
| Profit Factor | The ratio of gross profits to gross losses. | A measure of overall strategy efficiency. A factor above 1.7 is generally considered excellent for algorithmic strategies. |
| Grid Efficiency | The number of successful executed buy/sell cycles divided by the number of times the price crossed a grid line (an opportunity). | Measures if the density is too high or too low for the average market movement. |
| Safety Factor | How close the price came to hitting your lower boundary/stop-loss during the test period. | A higher safety factor indicates more robust bounds that won't be easily breached by normal market volatility. |
Parameter Deep Dive 1: Selecting Upper and Lower Bounds
The boundaries—the highest and lowest prices the bot is allowed to trade within—are the foundation of your grid. Setting them too narrowly means the bot will frequently exit the trading zone (either holding assets or cash). Setting them too wide dilutes the profitability of each grid.
Volatility Mapping and ATR
Instead of guessing your boundaries, use technical indicators to map the natural volatility of the asset. The most effective tool for this is the Average True Range (ATR).
What is ATR? ATR measures the average range between the high and low price of an asset over a given period (e.g., the last 14 days). It is expressed in price units (e.g., $50).
Applying ATR to Bounds: If you are running a grid bot on a four-hour chart, you can use the four-hour ATR to determine a statistically robust trading range.
- Establish the Midpoint (M): Use the current price or a strong volume-weighted average price (VWAP) as the center point.
- Calculate Bound Distance: Multiply the ATR by a chosen factor (e.g., 2.5x or 3x) to establish the risk buffer.
- Example: If Bitcoin is trading at $60,000, and the 14-period ATR is $500.
- Bound Distance = $500 (ATR) * 3 = $1,500.
- Upper Bound: $60,000 + $1,500 = $61,500
- Lower Bound: $60,000 - $1,500 = $58,500
By linking your boundaries to ATR, your grid bot automatically adjusts its range based on whether the market is calm (low ATR, tighter range) or highly volatile (high ATR, wider range). Backtest various multipliers (2x, 2.5x, 3x) to find the one that yields the best safety factor and profit factor.
Risk vs. Range Trade-off
The width of your range determines the trade-off between safety and transaction volume.
| Range Width | Description | Pros | Cons |
|---|---|---|---|
| Wide Range | A large buffer (e.g., 8-10% deviation from the midpoint). | High safety factor; less likely to break bounds; good for volatile, indecisive markets. | Low trading frequency; lower annualized returns; capital is tied up in a wide, non-trading area. |
| Narrow Range | A tight buffer (e.g., 2-4% deviation from the midpoint). | High trading frequency; higher potential returns; capital is used efficiently. | High risk of boundary breach; difficult to maintain without frequent manual intervention; only suitable for extremely tight consolidation. |
Backtesting Action: Test the same density (number of grids) across three different range widths (narrow, medium, wide) using historical data. Note how many times the bot exceeded the boundary in each scenario. Choose the setting that balances adequate trades with an acceptable safety factor.
Parameter Deep Dive 2: Density and Grid Count
Once the overall trading range (bounds) is set, the next optimization challenge is determining the density—how many grids (lines/rungs) to place within that range. This parameter directly dictates the profit per trade and the number of transactions the bot executes.
Calculating Profit per Grid
Density is a zero-sum game: more grids mean higher frequency but smaller profit per trade.
The calculation for the gross profit margin of a single grid line is straightforward:
- Example: Range of $400.
- If you use 10 grids, the distance between lines is $40. Gross profit is based on a $40 move.
- If you use 40 grids, the distance between lines is $10. Gross profit is based on a $10 move.
The Impact of Minimum Price Movement
Crypto exchanges have a minimum price fluctuation (often called the tick size). If your calculated grid line separation is smaller than the minimum price movement that reliably occurs on the asset in your chosen timeframe, your trades will fail to execute consistently.
Optimization Rule: Backtest your grid size against the average true tick movement over your intended operational time frame (e.g., 1 hour). If the price doesn't reliably move enough to cross your profit margin plus fees, the density is too high.
The Cost of Density (Fees and Spread)
For highly dense grids, transaction fees become the single greatest impediment to profitability.
Consider the $10 gross profit example above (40 grids over a $400 range).
- A buy order executes.
- A sell order executes.
- If your exchange fee is 0.1%, the fee for the round trip (buy + sell) is 0.2% of the trade value.
If the profit margin on the trade is $10, but the total transaction fees (based on the price of the asset) amount to $8, your net profit is only $2. If the fees exceed the gross profit, the bot is losing money with every trade.
Advanced Backtesting Requirement: Run a parameter sweep focusing only on the grid count (e.g., test 10, 20, 30, 40, and 50 grids). For each backtest result, calculate the total fees paid. The optimal grid count is the one that maximizes net profit after subtracting the simulated fees. For highly liquid assets like Bitcoin, the sweet spot often lies where the grid spacing is large enough to absorb two or three round-trip fees comfortably.
Essential Risk Management: Setting Stop-Losses for Grid Systems
A grid bot is inherently designed to sustain losses on the held asset temporarily, assuming the price will revert. However, when the mean reversion assumption fails—and a strong downtrend develops—a robust stop-loss mechanism is critical for capital preservation.
Unlike traditional trading where you might use a percentage stop-loss (e.g., 5% below entry), setting a stop-loss for a grid bot requires a different approach because the "entry" price is an aggregate of many buys.
Capital Preservation Stop-Loss (The Emergency Exit)
This is the ultimate safety net, designed to trigger only when the market structure fundamentally breaks down.
Methodology:
- Based on Technical Support: Set the stop-loss not just below the lower bound, but significantly below a proven historical support level or psychological round number. If the asset crashes through both the bot’s boundary and a critical technical support level, the mean reversion assumption has failed entirely, and holding the asset is dangerous.
- Based on Maximum Acceptable Drawdown: Determine the maximum temporary loss (in percentage of total capital) you are willing to accept. For example, if your total capital deployed is $10,000, and you will accept a maximum loss of $1,000 (10% drawdown), the stop-loss is triggered when the total unrealized loss (including all held coins) reaches $1,000.
Actionable Tip: Always choose the more conservative option: either the technical support level or the drawdown limit, whichever is triggered first.
The Break-Even Grid Exit
A sophisticated grid bot optimization includes a tactical, pre-emptive exit designed to minimize holding risk before the emergency stop-loss is triggered.
If the price consistently hovers near the lower bound without recovery, it indicates market weakness. The bot is holding a high quantity of the base crypto asset (e.g., BTC) because it has been systematically buying on the way down.
Strategy: Configure the bot to trigger a "Break-Even Exit" (or "Safety Conversion") when the price is, for instance, 1% above the lower bound. At this point, the bot calculates the weighted average entry price of all held assets and executes a single market sell order for all inventory, converting the entire position back into the quote currency (e.g., USD, stablecoin).
The Benefit: This exit sacrifices potential future profits but significantly reduces the risk of a catastrophic crash, allowing the trader to manually re-evaluate the market and redeploy the bot later, rather than letting it ride into a major loss. Backtest this tactical exit to determine the ideal proximity (1%, 0.5%, 2% above the lower bound) that provides the best balance between safety and avoiding premature exits.
Adapting to Market Dynamics: Identifying Mean Reversion vs. Trend
The single most critical factor in grid bot profitability is timing. Deploying a grid bot during a trending market is the primary reason for massive losses. Advanced optimization involves adding conditional logic to your bot to detect and react to shifting market dynamics.
Identifying Mean Reversion Conditions
A grid bot should only be active when the market exhibits traits that suggest price will remain range-bound.
Indicators for Ranging Markets:
- Flat Moving Averages (MAs): Look for periods where the 50-period and 200-period Simple Moving Averages (SMAs) are close together and flat (not steeply angled up or down). This suggests a lack of strong directional momentum.
- Bollinger Bands (BB) Contraction: Bollinger Bands measure volatility around a moving average. When the bands contract (move closer together), it signals that volatility is low and the asset is consolidating, making it an ideal environment for mean reversion and grid strategies.
- Horizontal Support and Resistance: The price should respect clear, horizontal levels of support (floor) and resistance (ceiling). These levels define the optimal candidates for your manual or ATR-derived upper and lower bounds.
Optimization Application: Backtest your bot and only record results for the periods where the 50-period MA was within 0.5% of the 200-period MA. This isolates the bot’s performance to the optimal market structure.
Detecting Trending Markets (When to Pause)
A strong trend means the grid bot is about to either run out of inventory (in an uptrend) or, worse, become a liability (in a downtrend). Optimized bots must have an automatic mechanism to pause or shut down.
Trend Detection Triggers for Automated Pause:
- Breakout of ATR Bounds: If the price exceeds the current boundaries set by the ATR calculation (e.g., the 3x ATR upper bound), it indicates volatility is suddenly higher than the strategy was designed for. The bot should pause immediately.
- MACD Divergence and Crossover: The Moving Average Convergence Divergence (MACD) is a powerful momentum indicator.
- Downtrend Signal: If the MACD line crosses below the signal line and the value drops significantly below zero, it confirms accelerating bearish momentum. This is a crucial signal to pause the grid bot and activate the stop-loss or break-even exit.
- Uptrend Signal: If the MACD crosses significantly above zero, the bot should pause its buying (to avoid over-buying the top of the grid) and prepare for the upper bound exit.
- Moving Average Angle: Monitor the 20-period Exponential Moving Average (EMA). If the angle of the EMA increases above a certain slope (e.g., 10 degrees) for several consecutive periods, it confirms the establishment of a trend, making mean reversion strategies obsolete.
Optimization Goal: Backtest the timing of these pause triggers. A pause triggered too early sacrifices potential profit; one triggered too late leads to heavy losses. Aim for a trigger that captures 80% of the profitable range before exiting.
Advanced Optimization Methodology: Putting It All Together
Optimization is rarely a one-step process. It requires iterative testing across a multi-dimensional parameter space—a process often called Parameter Sweeping.
Parameter Sweeping: Systematic Variation
Instead of manually changing one setting at a time, parameter sweeping allows you to test many combinations simultaneously across a large historical dataset.
Scenario Example: Optimizing BTC/USD for 1-Hour Chart
| Parameter | Test Values (Example Sweep) |
|---|---|
| ATR Multiplier (Bounds) | 2.0x, 2.5x, 3.0x |
| Grid Count (Density) | 10, 15, 20, 25 |
| Stop-Loss Placement (Below Lower Bound) | 0.5%, 1.0%, 1.5% |
This scenario creates unique strategies. Each of these 36 strategies must be run across the same historical data set (ensuring the data includes consolidation and volatility spikes).
Interpreting the Sweep Results:
The goal is not simply to find the highest P&L. The best-performing parameter set is the one that exhibits the most desirable balance across the key metrics:
- Highest Profit Factor (above 1.7).
- Lowest Maximum Drawdown (e.g., below 5%).
- Acceptable Safety Factor (the price never approached the stop-loss within 0.5%).
If a specific parameter set showed incredible profitability but also a 40% maximum drawdown, it is inherently too risky and should be discarded, regardless of P&L. Robustness always outweighs historical profit maximization.
Optimization in Live Environments (Paper Trading)
After rigorous backtesting, the next essential step is paper trading (or simulation trading). Historical data, no matter how detailed, cannot fully replicate the real-world trading environment.
Why Paper Trading is Crucial:
- Slippage Reality Check: Backtesting often simplifies slippage (the difference between the expected execution price and the actual execution price). Paper trading provides real-time data on execution latency and confirms whether the tiny profit margins from dense grids are being eaten away by market inefficiencies.
- API and Execution Reliability: It confirms that the bot’s connection to the exchange (via API) is robust and can handle rapid execution sequences without timing out or failing orders, which is common in high-frequency strategies.
- Emotional Distance: Paper trading allows you to observe the bot’s performance in real-time, especially during minor downturns, without the emotional pressure of having real capital on the line. This builds confidence in the strategy before deployment.
Best Practice: Run the top 3-5 parameter sets identified during backtesting concurrently in the paper trading environment for a minimum of 30 days before committing live capital to the best performer.
Dynamic Repositioning and Recalibration
Market conditions are not static. The optimal grid boundaries and density for a low-volatility summer month will likely be ineffective during a high-volatility crash or a trending environment.
Advanced Implementation: Implement a mechanism for dynamic recalibration. Instead of setting the bounds once and walking away, the bot (or the automated system running the bot) should:
- Monitor the ATR: Recalculate the ATR every 24 hours.
- Adjust Bounds: If the new ATR reading significantly changes the optimal bounds, the bot should be programmed to pause, close the current position (using the break-even exit mechanism), and redeploy the grid with the new, optimized boundaries and density reflective of the current volatility.
This dynamic approach ensures the grid bot remains optimized for the current reality of the market, transforming it from a static strategy into an adaptive, sophisticated trading tool.
Conclusion
Optimizing grid trading bots is an iterative, data-driven discipline, far removed from the passive "set it and forget it" trading often marketed to beginners. The success of a grid strategy hinges entirely on mastering its core parameters and having a robust, backtested methodology.
By using technical tools like ATR to scientifically determine realistic trading bounds, carefully balancing grid density against transaction costs, and implementing tactical and emergency stop-loss protocols, traders can significantly enhance their bot's robustness. Most importantly, integrating conditional logic to identify when a market is ranging (mean reversion) versus when it is trending allows the bot to protect capital by pausing or exiting before major trend breaks lead to catastrophic losses.
Through rigorous parameter sweeping and extensive paper trading, you can refine your grid bot to be a highly efficient automated tool, capable of consistently extracting profit from the inevitable volatility within consolidated crypto markets.